
U.S. Power Outage Statistics, 2014–2024
Explore EIA's annual U.S. distribution-system SAIDI, SAIFI and CAIDI data from 2014 to 2024, with separate IEEE and Any Method series.
Last updated October 2026
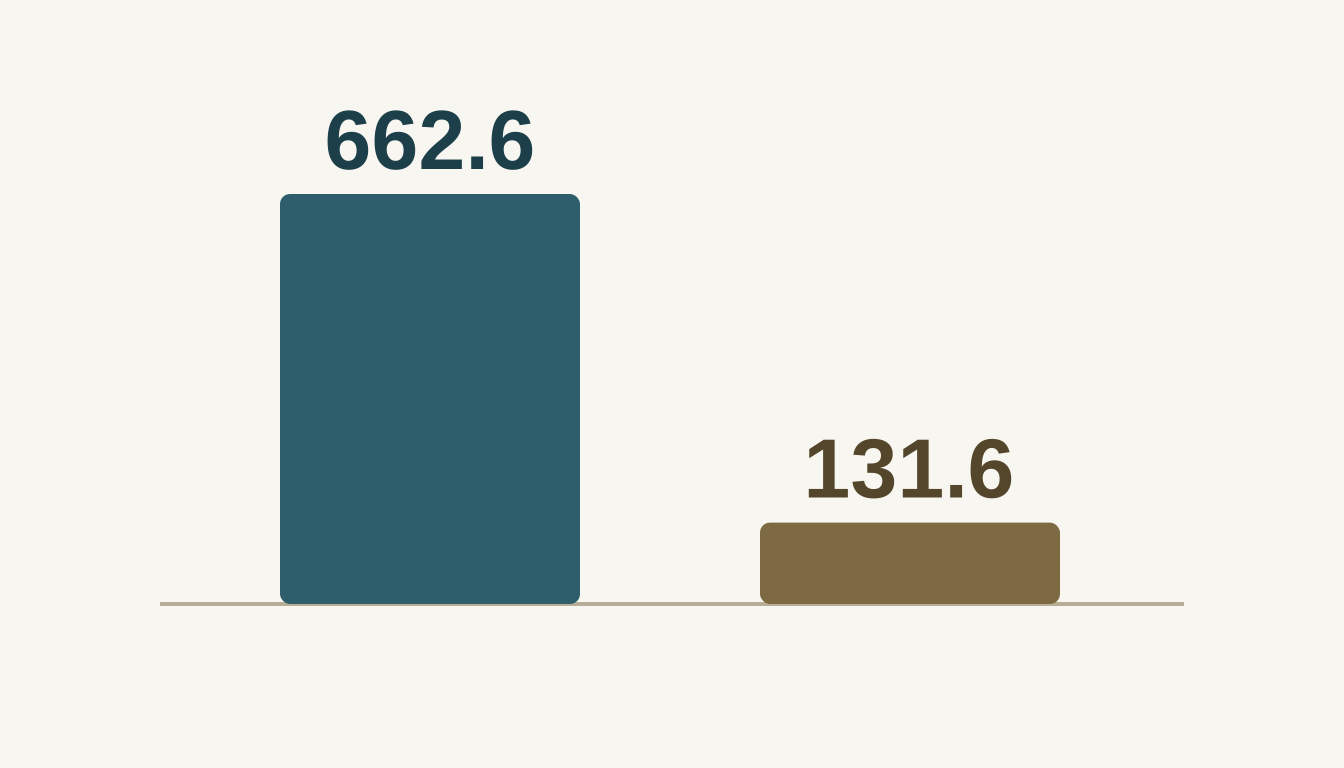
2024 IEEE SAIDI: left bar, all events, 662.6 minutes per customer-year; right bar, without major event days, 131.6 minutes per customer-year. These are separate published treatments.
Contents7
Compare annual outage minutes by state, then check the national record. EIA methods and major-event treatments stay separate. Latest published year: 2024; history: 2014–2024.
SAIDI measures minutes of non-momentary interruptions per customer-year. SAIFI measures interruptions per customer-year. CAIDI measures restoration minutes per interruption. An annual average is not the length of one outage or a forecast for your home.
National overview: latest year and first-to-last change
Each row is a separate population/treatment. Signed changes are derived: 2024 minus 2014 in the same units. This is not a causal or fixed-coverage trend estimate.
| Series | SAIDI | SAIFI | CAIDI |
|---|---|---|---|
| IEEE all events | 662.6 minutes per customer-year Derived change: +426.4 | 1.531 interruptions per customer-year Derived change: +0.274 | 432.7 minutes per interruption Derived change: +244.7 |
| IEEE without major event days | 131.6 minutes per customer-year Derived change: +17.4 | 1.065 interruptions per customer-year Derived change: +0.027 | 123.6 minutes per interruption Derived change: +13.6 |
| IEEE loss of supply removed | 646.1 minutes per customer-year Derived change: +401.3 | 1.431 interruptions per customer-year Derived change: +0.229 | 451.6 minutes per interruption Derived change: +247.9 |
| Any Method all events | 611.3 minutes per customer-year Derived change: +392.3 | 1.521 interruptions per customer-year Derived change: +0.301 | 401.9 minutes per interruption Derived change: +222.3 |
| Any Method without major events | 126 minutes per customer-year Derived change: +16.3 | 1.043 interruptions per customer-year Derived change: +0.024 | 120.8 minutes per interruption Derived change: +13.1 |
Scroll for more →
National findings, with arithmetic
- Derived: IEEE all-events SAIDI rose 180.5% from 2014 to 2024. 662.6 − 236.2 = 426.4 minutes per customer-year. These are the first and last years, not the minimum and maximum.
- Derived: the 2024 IEEE event-treatment gap is 531.0 minutes per customer-year. 662.6 − 131.6; 80.1% of the all-events value. This does not identify a cause.
- Observed: IEEE all-events SAIDI is highest in this eleven-year snapshot at 662.6 in 2024 and lowest at 209 in 2015.
- Derived, min-to-max only: 662.6 − 209 = 453.6 minutes; 217.0%. This is the 2015 minimum to 2024 maximum, not the first-to-last change.
Power outage minutes by state, 2024
These are observed EIA-published state aggregates, not our utility estimates. This view ranks IEEE SAIDI only. The state CSV preserves all three metrics and all five EIA series for 50 states, D.C. and the U.S. over 2014–2024. Blank source cells display UNKNOWN; numeric CSV fields are empty with per-metric status columns. Any Method is not blended into the IEEE ranking.
- Observed, one year (2024): South Carolina has the most all-events outage minutes among the 50 states: 3155 minutes per customer-year. Derived 2014–2024 range for South Carolina: 122.9–3155. This single-year ranking does not establish a persistently worst state.
- Observed, one year (2024): Arizona has the fewest: 83.6 minutes per customer-year. Derived 2014–2024 range for Arizona: 70.6–136.9; a single year is not a household forecast.
- Observed, one year (2024): West Virginia has the highest without-major-event-days value: 486.1 minutes per customer-year. Derived 2014–2024 range for West Virginia, same treatment: 385.7–543.6.
- Derived, one year (2024): South Carolina has the widest gap: 3155 − 115.9 = 3039.1 minutes per customer-year. Derived 2014–2024 range of annual gaps for South Carolina: 21.6–3039.1. This subtraction does not attribute the difference to weather.
National reference, same IEEE measures: all events 662.6; without major event days 131.6 minutes per customer-year. This is EIA's published national aggregate, not an average of states. Findings above exclude D.C.; the table labels it separately.
Sort using the column-header buttons. Press again to reverse the order.
51 state/D.C. records, name order.
| State / D.C. | With major event days | Without major event days | Derived gap: all − without |
|---|---|---|---|
| Alabama | 197.7 | 120.8 | 76.9 |
| Alaska | 323.2 | 192.4 | 130.8 |
| Arizona | 83.6 | 69.8 | 13.8 |
| Arkansas | 527.8 | 201.9 | 325.9 |
| California | 285 | 164.4 | 120.6 |
| Colorado | 257 | 118.9 | 138.1 |
| Connecticut | 152.8 | 73.6 | 79.2 |
| Delaware | 117.9 | 66.8 | 51.1 |
| District of Columbia | 32.6 | 26.4 | 6.2 |
| Florida | 1487.6 | 66.7 | 1420.9 |
| Georgia | 1208.1 | 211.4 | 996.7 |
| Hawaii | 382.6 | 219.3 | 163.3 |
| Idaho | 204.4 | 152.5 | 51.9 |
| Illinois | 158 | 59.1 | 98.9 |
| Indiana | 310 | 123.3 | 186.7 |
| Iowa | 200.3 | 84.1 | 116.2 |
| Kansas | 289.8 | 104 | 185.8 |
| Kentucky | 537.7 | 145.7 | 392.0 |
| Louisiana | 630.6 | 215.9 | 414.7 |
| Maine | 1748.6 | 274 | 1474.6 |
| Maryland | 118.1 | 75.1 | 43.0 |
| Massachusetts | 103.7 | 77 | 26.7 |
| Michigan | 481.7 | 161.3 | 320.4 |
| Minnesota | 222.4 | 91.5 | 130.9 |
| Mississippi | 607.3 | 279 | 328.3 |
| Missouri | 212.6 | 106.6 | 106.0 |
| Montana | 341.7 | 152.3 | 189.4 |
| Nebraska | 697.8 | 69.8 | 628.0 |
| Nevada | 158.9 | 63.8 | 95.1 |
| New Hampshire | 735.5 | 84.2 | 651.3 |
| New Jersey | 173.3 | 98.8 | 74.5 |
| New Mexico | 272.6 | 152 | 120.6 |
| New York | 477.3 | 142.8 | 334.5 |
| North Carolina | 1518.1 | 143.9 | 1374.2 |
| North Dakota | 102.7 | 87 | 15.7 |
| Ohio | 511 | 133.3 | 377.7 |
| Oklahoma | 220.7 | 121.3 | 99.4 |
| Oregon | 579.3 | 124.1 | 455.2 |
| Pennsylvania | 353.1 | 131.5 | 221.6 |
| Rhode Island | 104.3 | 60.8 | 43.5 |
| South Carolina | 3155 | 115.9 | 3039.1 |
| South Dakota | 85.6 | 61.5 | 24.1 |
| Tennessee | 289.3 | 169.9 | 119.4 |
| Texas | 1614.3 | 153.4 | 1460.9 |
| Utah | 115.4 | 105 | 10.4 |
| Vermont | 895.8 | 231.8 | 664.0 |
| Virginia | 962.1 | 245.1 | 717.0 |
| Washington | 643.5 | 157.3 | 486.2 |
| West Virginia | 1165.5 | 486.1 | 679.4 |
| Wisconsin | 296.8 | 97.5 | 199.3 |
| Wyoming | 137.8 | 116 | 21.8 |
Scroll for more →
Ranked chart: 2024 IEEE all-events minutes (51 state/D.C. records)
Common scale from zero. Values are minutes per customer-year. D.C. is not a state. The separate without-major-event treatment is in the table.
- South Carolina3155
- Maine1748.6
- Texas1614.3
- North Carolina1518.1
- Florida1487.6
- Georgia1208.1
- West Virginia1165.5
- Virginia962.1
- Vermont895.8
- New Hampshire735.5
- Nebraska697.8
- Washington643.5
- Louisiana630.6
- Mississippi607.3
- Oregon579.3
- Kentucky537.7
- Arkansas527.8
- Ohio511
- Michigan481.7
- New York477.3
- Hawaii382.6
- Pennsylvania353.1
- Montana341.7
- Alaska323.2
- Indiana310
- Wisconsin296.8
- Kansas289.8
- Tennessee289.3
- California285
- New Mexico272.6
- Colorado257
- Minnesota222.4
- Oklahoma220.7
- Missouri212.6
- Idaho204.4
- Iowa200.3
- Alabama197.7
- New Jersey173.3
- Nevada158.9
- Illinois158
- Connecticut152.8
- Wyoming137.8
- Maryland118.1
- Delaware117.9
- Utah115.4
- Rhode Island104.3
- Massachusetts103.7
- North Dakota102.7
- South Dakota85.6
- Arizona83.6
- District of Columbia32.6
State history, 2014–2024
Open a state to read every year and all three metrics. IEEE and Any Method stay in separate tables; event treatments stay in separate columns. UNKNOWN means the EIA cell is blank. Published zeros are labelled in the Hawaii notes. The full CSV includes the U.S. reference as well.
No state selected.
Alabama — 2014–2024 history
Direct link to Alabama · Choose another state
Alabama: IEEE
| Year | With major event days | Without major event days | Loss of supply removed |
|---|---|---|---|
| 2014 | 282.9 | 154.9 | 289.6 |
| 2015 | 274.7 | 167.9 | 224.2 |
| 2016 | 174.2 | 140.1 | 161 |
| 2017 | 242.4 | 130.8 | 199.5 |
| 2018 | 457.8 | 136.8 | 195.4 |
| 2019 | 183.7 | 106.8 | 158.4 |
| 2020 | 3320.4 | 144.6 | 3440.8 |
| 2021 | 175.7 | 110.9 | 215.8 |
| 2022 | 231.3 | 198.4 | 230.1 |
| 2023 | 400.2 | 189.5 | 380.2 |
| 2024 | 197.7 | 120.8 | 189.6 |
Scroll for more →
| Year | With major event days | Without major event days | Loss of supply removed |
|---|---|---|---|
| 2014 | 2.04 | 1.675 | 1.97 |
| 2015 | 2.021 | 1.625 | 1.842 |
| 2016 | 1.759 | 1.541 | 1.492 |
| 2017 | 1.92 | 1.403 | 1.754 |
| 2018 | 1.959 | 1.488 | 1.744 |
| 2019 | 1.783 | 1.097 | 1.528 |
| 2020 | 3.499 | 1.372 | 3.364 |
| 2021 | 1.378 | 1.161 | 1.58 |
| 2022 | 2.28 | 1.973 | 2.151 |
| 2023 | 2.281 | 1.481 | 1.972 |
| 2024 | 1.749 | 1.29 | 1.654 |
Scroll for more →
| Year | With major event days | Without major event days | Loss of supply removed |
|---|---|---|---|
| 2014 | 138.6 | 92.5 | 147 |
| 2015 | 135.9 | 103.3 | 121.7 |
| 2016 | 99 | 91 | 108 |
| 2017 | 126.3 | 93.3 | 113.8 |
| 2018 | 233.7 | 92 | 112.1 |
| 2019 | 103 | 97.4 | 103.7 |
| 2020 | 948.8 | 105.4 | 1023 |
| 2021 | 127.5 | 95.5 | 136.5 |
| 2022 | 101.4 | 100.6 | 106.9 |
| 2023 | 175.4 | 128 | 192.8 |
| 2024 | 113 | 93.6 | 114.6 |
Scroll for more →
Alabama: Any Method
| Year | With major event days | Without major event days |
|---|---|---|
| 2014 | 206.1 | 125.4 |
| 2015 | 212.3 | 124.9 |
| 2016 | 174.8 | 115.8 |
| 2017 | 314.5 | 115.9 |
| 2018 | 308 | 120.6 |
| 2019 | 174.1 | 120.2 |
| 2020 | 1743.5 | 127.3 |
| 2021 | 234.9 | 119.1 |
| 2022 | 210.1 | 138.8 |
| 2023 | 294.2 | 120.2 |
| 2024 | 279.4 | 117.8 |
Scroll for more →
| Year | With major event days | Without major event days |
|---|---|---|
| 2014 | 1.476 | 1.139 |
| 2015 | 1.699 | 1.244 |
| 2016 | 1.571 | 1.167 |
| 2017 | 1.959 | 1.07 |
| 2018 | 1.522 | 1.174 |
| 2019 | 1.41 | 1.1 |
| 2020 | 2.381 | 1.13 |
| 2021 | 1.43 | 1.08 |
| 2022 | 1.448 | 1.159 |
| 2023 | 1.574 | 0.979 |
| 2024 | 1.87 | 1.037 |
Scroll for more →
| Year | With major event days | Without major event days |
|---|---|---|
| 2014 | 139.6 | 110.1 |
| 2015 | 124.9 | 100.4 |
| 2016 | 111.2 | 99.3 |
| 2017 | 160.5 | 108.3 |
| 2018 | 202.3 | 102.8 |
| 2019 | 123.5 | 109.3 |
| 2020 | 732.4 | 112.6 |
| 2021 | 164.3 | 110.3 |
| 2022 | 145.1 | 119.8 |
| 2023 | 186.9 | 122.8 |
| 2024 | 149.4 | 113.6 |
Scroll for more →
Alaska — 2014–2024 history
Direct link to Alaska · Choose another state
Alaska: IEEE
| Year | With major event days | Without major event days | Loss of supply removed |
|---|---|---|---|
| 2014 | 312 | 161.5 | 264.9 |
| 2015 | 657.8 | 155.1 | 782.3 |
| 2016 | 196.6 | 176.9 | 272.5 |
| 2017 | 149.2 | 136.9 | 159.6 |
| 2018 | 339.3 | 193.1 | 359.2 |
| 2019 | 279 | 184.1 | 317.1 |
| 2020 | 256.9 | 245.5 | 251.4 |
| 2021 | 537.3 | 230.6 | 501.7 |
| 2022 | 891.3 | 334.9 | 820.6 |
| 2023 | 499.4 | 325.7 | 472.5 |
| 2024 | 323.2 | 192.4 | 371 |
Scroll for more →
| Year | With major event days | Without major event days | Loss of supply removed |
|---|---|---|---|
| 2014 | 2.259 | 1.57 | 2.722 |
| 2015 | 2.319 | 1.531 | 2.55 |
| 2016 | 2.111 | 1.858 | 2.444 |
| 2017 | 1.574 | 1.826 | 1.548 |
| 2018 | 2.931 | 2.603 | 2.345 |
| 2019 | 1.92 | 1.588 | 1.578 |
| 2020 | 1.968 | 2.218 | 1.501 |
| 2021 | 2.372 | 1.723 | 1.778 |
| 2022 | 4.959 | 3.406 | 3.431 |
| 2023 | 3.26 | 2.366 | 2.503 |
| 2024 | 2.321 | 1.862 | 1.84 |
Scroll for more →
| Year | With major event days | Without major event days | Loss of supply removed |
|---|---|---|---|
| 2014 | 138.1 | 102.8 | 97.3 |
| 2015 | 283.6 | 101.3 | 306.8 |
| 2016 | 93.1 | 95.2 | 111.5 |
| 2017 | 94.8 | 75 | 103.1 |
| 2018 | 115.8 | 74.2 | 153.2 |
| 2019 | 145.3 | 116 | 201 |
| 2020 | 130.5 | 110.7 | 167.5 |
| 2021 | 226.6 | 133.8 | 282.1 |
| 2022 | 179.7 | 98.3 | 239.2 |
| 2023 | 153.2 | 137.6 | 188.8 |
| 2024 | 139.3 | 103.3 | 201.7 |
Scroll for more →
Alaska: Any Method
| Year | With major event days | Without major event days |
|---|---|---|
| 2014 | 313.8 | 161.5 |
| 2015 | 605.4 | 155.1 |
| 2016 | 192.5 | 176.9 |
| 2017 | 152.7 | 136.9 |
| 2018 | 335.3 | 193.1 |
| 2019 | 280.1 | 184.1 |
| 2020 | 268 | 245.5 |
| 2021 | 379.1 | 230.6 |
| 2022 | 575.2 | 334.9 |
| 2023 | 374.8 | 325.7 |
| 2024 | 327.1 | 192.4 |
Scroll for more →
| Year | With major event days | Without major event days |
|---|---|---|
| 2014 | 2.484 | 1.57 |
| 2015 | 2.555 | 1.531 |
| 2016 | 2.261 | 1.858 |
| 2017 | 1.709 | 1.826 |
| 2018 | 3.137 | 2.603 |
| 2019 | 2.192 | 1.588 |
| 2020 | 2.195 | 2.218 |
| 2021 | 2.132 | 1.723 |
| 2022 | 3.523 | 3.406 |
| 2023 | 2.701 | 2.366 |
| 2024 | 2.591 | 1.862 |
Scroll for more →
| Year | With major event days | Without major event days |
|---|---|---|
| 2014 | 126.4 | 102.8 |
| 2015 | 236.9 | 101.3 |
| 2016 | 85.1 | 95.2 |
| 2017 | 89.3 | 75 |
| 2018 | 106.9 | 74.2 |
| 2019 | 127.8 | 116 |
| 2020 | 122.1 | 110.7 |
| 2021 | 177.8 | 133.8 |
| 2022 | 163.3 | 98.3 |
| 2023 | 138.8 | 137.6 |
| 2024 | 126.3 | 103.3 |
Scroll for more →
Arizona — 2014–2024 history
Direct link to Arizona · Choose another state
Arizona: IEEE
| Year | With major event days | Without major event days | Loss of supply removed |
|---|---|---|---|
| 2014 | 86.9 | 59.8 | 83.4 |
| 2015 | 89.6 | 66 | 87.4 |
| 2016 | 86.9 | 67.9 | 85.9 |
| 2017 | 89.5 | 50.8 | 82.9 |
| 2018 | 111.6 | 57.6 | 94.3 |
| 2019 | 83.3 | 64 | 71.6 |
| 2020 | 70.6 | 62 | 65 |
| 2021 | 101.9 | 69.3 | 91 |
| 2022 | 136.9 | 69.1 | 103.7 |
| 2023 | 103.8 | 66.9 | 88.7 |
| 2024 | 83.6 | 69.8 | 75.8 |
Scroll for more →
| Year | With major event days | Without major event days | Loss of supply removed |
|---|---|---|---|
| 2014 | 0.844 | 0.717 | 0.788 |
| 2015 | 0.857 | 0.776 | 0.789 |
| 2016 | 0.839 | 0.756 | 0.781 |
| 2017 | 0.867 | 0.562 | 0.81 |
| 2018 | 0.917 | 0.582 | 0.823 |
| 2019 | 0.865 | 0.748 | 0.782 |
| 2020 | 0.797 | 0.742 | 0.75 |
| 2021 | 1.055 | 0.813 | 0.988 |
| 2022 | 1.024 | 0.871 | 0.979 |
| 2023 | 0.951 | 0.788 | 0.916 |
| 2024 | 0.963 | 0.88 | 0.935 |
Scroll for more →
| Year | With major event days | Without major event days | Loss of supply removed |
|---|---|---|---|
| 2014 | 103 | 83.4 | 105.8 |
| 2015 | 104.6 | 85 | 110.9 |
| 2016 | 103.6 | 89.8 | 110 |
| 2017 | 103.3 | 90.3 | 102.4 |
| 2018 | 121.6 | 98.9 | 114.5 |
| 2019 | 96.3 | 85.6 | 91.5 |
| 2020 | 88.6 | 83.5 | 86.7 |
| 2021 | 96.6 | 85.2 | 92.1 |
| 2022 | 133.7 | 79.4 | 106 |
| 2023 | 109.2 | 84.9 | 96.8 |
| 2024 | 86.8 | 79.4 | 81.1 |
Scroll for more →
Arizona: Any Method
| Year | With major event days | Without major event days |
|---|---|---|
| 2014 | 87.2 | 59.7 |
| 2015 | 90.9 | 66 |
| 2016 | 86.3 | 67.5 |
| 2017 | 90.7 | 51.4 |
| 2018 | 114.6 | 61.1 |
| 2019 | 85.8 | 67.2 |
| 2020 | 71.9 | 63.6 |
| 2021 | 106.2 | 71.7 |
| 2022 | 139.7 | 72.3 |
| 2023 | 106.8 | 69.3 |
| 2024 | 87.5 | 72 |
Scroll for more →
| Year | With major event days | Without major event days |
|---|---|---|
| 2014 | 0.84 | 0.717 |
| 2015 | 0.857 | 0.776 |
| 2016 | 0.833 | 0.751 |
| 2017 | 0.885 | 0.575 |
| 2018 | 0.943 | 0.611 |
| 2019 | 0.886 | 0.775 |
| 2020 | 0.818 | 0.767 |
| 2021 | 1.22 | 0.973 |
| 2022 | 1.053 | 0.897 |
| 2023 | 0.984 | 0.817 |
| 2024 | 0.988 | 0.898 |
Scroll for more →
| Year | With major event days | Without major event days |
|---|---|---|
| 2014 | 103.7 | 83.3 |
| 2015 | 106 | 85 |
| 2016 | 103.5 | 89.8 |
| 2017 | 102.5 | 89.4 |
| 2018 | 121.6 | 100.1 |
| 2019 | 96.8 | 86.8 |
| 2020 | 88 | 82.9 |
| 2021 | 87 | 73.7 |
| 2022 | 132.7 | 80.6 |
| 2023 | 108.6 | 84.8 |
| 2024 | 88.6 | 80.1 |
Scroll for more →
Arkansas — 2014–2024 history
Direct link to Arkansas · Choose another state
Arkansas: IEEE
| Year | With major event days | Without major event days | Loss of supply removed |
|---|---|---|---|
| 2014 | 238.5 | 216.5 | 593.9 |
| 2015 | 326.2 | 222.6 | 324.8 |
| 2016 | 400.5 | 213.7 | 404.8 |
| 2017 | 405.6 | 176 | 383 |
| 2018 | 330.9 | 214.1 | 325.8 |
| 2019 | 451.2 | 228 | 376.1 |
| 2020 | 771.6 | 210.6 | 727.9 |
| 2021 | 308.4 | 199.4 | 286.2 |
| 2022 | 437.5 | 279.6 | 427.2 |
| 2023 | 915.3 | 230.7 | 879 |
| 2024 | 527.8 | 201.9 | 377.8 |
Scroll for more →
| Year | With major event days | Without major event days | Loss of supply removed |
|---|---|---|---|
| 2014 | 1.841 | 1.585 | 2.177 |
| 2015 | 2.05 | 1.779 | 1.853 |
| 2016 | 2.084 | 1.717 | 1.867 |
| 2017 | 2.089 | 1.48 | 1.859 |
| 2018 | 1.721 | 1.473 | 1.613 |
| 2019 | 1.94 | 1.522 | 1.676 |
| 2020 | 1.858 | 1.437 | 1.669 |
| 2021 | 1.674 | 1.401 | 1.434 |
| 2022 | 2.16 | 1.803 | 1.886 |
| 2023 | 2.123 | 1.578 | 1.909 |
| 2024 | 2.137 | 1.617 | 1.807 |
Scroll for more →
| Year | With major event days | Without major event days | Loss of supply removed |
|---|---|---|---|
| 2014 | 129.5 | 136.6 | 272.8 |
| 2015 | 159.1 | 125.1 | 175.2 |
| 2016 | 192.2 | 124.5 | 216.8 |
| 2017 | 194.2 | 118.9 | 206.1 |
| 2018 | 192.3 | 145.4 | 202.1 |
| 2019 | 232.5 | 149.8 | 224.3 |
| 2020 | 415.3 | 146.5 | 436.2 |
| 2021 | 184.2 | 142.3 | 199.6 |
| 2022 | 202.5 | 155.1 | 226.5 |
| 2023 | 431.2 | 146.2 | 460.4 |
| 2024 | 247 | 124.8 | 209.2 |
Scroll for more →
Arkansas: Any Method
| Year | With major event days | Without major event days |
|---|---|---|
| 2014 | 235.1 | 212.2 |
| 2015 | 306.7 | 216.8 |
| 2016 | 397.3 | 208.3 |
| 2017 | 395.4 | 178.3 |
| 2018 | 322.9 | 210 |
| 2019 | 437.7 | 221.9 |
| 2020 | 708.4 | 204.7 |
| 2021 | 315.9 | 195.9 |
| 2022 | 415.5 | 274.7 |
| 2023 | 911.2 | 221.7 |
| 2024 | 509.1 | 194.6 |
Scroll for more →
| Year | With major event days | Without major event days |
|---|---|---|
| 2014 | 1.793 | 1.551 |
| 2015 | 1.982 | 1.752 |
| 2016 | 2.033 | 1.677 |
| 2017 | 2.046 | 1.455 |
| 2018 | 1.771 | 1.483 |
| 2019 | 1.934 | 1.508 |
| 2020 | 1.833 | 1.434 |
| 2021 | 1.658 | 1.383 |
| 2022 | 2.11 | 1.77 |
| 2023 | 2.102 | 1.54 |
| 2024 | 2.128 | 1.587 |
Scroll for more →
| Year | With major event days | Without major event days |
|---|---|---|
| 2014 | 131.1 | 136.8 |
| 2015 | 154.8 | 123.8 |
| 2016 | 195.4 | 124.2 |
| 2017 | 193.3 | 122.6 |
| 2018 | 182.3 | 141.6 |
| 2019 | 226.3 | 147.1 |
| 2020 | 386.5 | 142.7 |
| 2021 | 190.5 | 141.7 |
| 2022 | 196.9 | 155.2 |
| 2023 | 433.4 | 144 |
| 2024 | 239.3 | 122.7 |
Scroll for more →
California — 2014–2024 history
Direct link to California · Choose another state
California: IEEE
| Year | With major event days | Without major event days | Loss of supply removed |
|---|---|---|---|
| 2014 | 113 | 103.3 | 116.8 |
| 2015 | 120.4 | 93.2 | 123.9 |
| 2016 | 119.9 | 100.8 | 119.7 |
| 2017 | 243.2 | 104 | 190.2 |
| 2018 | 199.4 | 99.5 | 150 |
| 2019 | 610.7 | 106.7 | 615.7 |
| 2020 | 280.7 | 107.6 | 266 |
| 2021 | 335.2 | 148 | 266 |
| 2022 | 202.4 | 156.5 | 195.3 |
| 2023 | 352.5 | 157.1 | 351.5 |
| 2024 | 285 | 164.4 | 306.3 |
Scroll for more →
| Year | With major event days | Without major event days | Loss of supply removed |
|---|---|---|---|
| 2014 | 0.914 | 0.873 | 0.94 |
| 2015 | 0.916 | 0.816 | 0.933 |
| 2016 | 1.014 | 0.923 | 1.022 |
| 2017 | 1.275 | 0.884 | 0.771 |
| 2018 | 0.958 | 0.857 | 0.504 |
| 2019 | 1.259 | 0.872 | 0.869 |
| 2020 | 1.093 | 0.883 | 0.443 |
| 2021 | 1.315 | 1.042 | 0.8 |
| 2022 | 1.259 | 1.146 | 1.221 |
| 2023 | 1.409 | 1.097 | 1.393 |
| 2024 | 1.353 | 1.181 | 1.429 |
Scroll for more →
| Year | With major event days | Without major event days | Loss of supply removed |
|---|---|---|---|
| 2014 | 123.5 | 118.3 | 124.2 |
| 2015 | 131.5 | 114.2 | 132.9 |
| 2016 | 118.3 | 109.2 | 117.1 |
| 2017 | 190.7 | 117.6 | 246.7 |
| 2018 | 208.1 | 116.2 | 297.5 |
| 2019 | 485.2 | 122.3 | 708.4 |
| 2020 | 256.8 | 121.9 | 600.9 |
| 2021 | 254.9 | 142 | 332.4 |
| 2022 | 160.7 | 136.5 | 160 |
| 2023 | 250.2 | 143.2 | 252.4 |
| 2024 | 210.7 | 139.2 | 214.3 |
Scroll for more →
California: Any Method
| Year | With major event days | Without major event days |
|---|---|---|
| 2014 | 108.8 | 99.8 |
| 2015 | 118.4 | 91.9 |
| 2016 | 117.1 | 98.7 |
| 2017 | 233.4 | 100.9 |
| 2018 | 195.2 | 96 |
| 2019 | 587.6 | 103.9 |
| 2020 | 267.1 | 104 |
| 2021 | 325.2 | 142.7 |
| 2022 | 198.5 | 150.5 |
| 2023 | 346.6 | 152 |
| 2024 | 279.6 | 158.2 |
Scroll for more →
| Year | With major event days | Without major event days |
|---|---|---|
| 2014 | 0.911 | 0.873 |
| 2015 | 0.925 | 0.833 |
| 2016 | 1.027 | 0.938 |
| 2017 | 1.284 | 0.894 |
| 2018 | 0.955 | 0.854 |
| 2019 | 1.261 | 0.876 |
| 2020 | 1.077 | 0.879 |
| 2021 | 1.309 | 1.033 |
| 2022 | 1.248 | 1.127 |
| 2023 | 1.397 | 1.086 |
| 2024 | 1.345 | 1.154 |
Scroll for more →
| Year | With major event days | Without major event days |
|---|---|---|
| 2014 | 119.4 | 114.2 |
| 2015 | 128 | 110.3 |
| 2016 | 114 | 105.1 |
| 2017 | 181.8 | 112.8 |
| 2018 | 204.5 | 112.4 |
| 2019 | 465.9 | 118.6 |
| 2020 | 247.9 | 118.3 |
| 2021 | 248.4 | 138.1 |
| 2022 | 159.1 | 133.5 |
| 2023 | 248.1 | 140 |
| 2024 | 208 | 137.1 |
Scroll for more →
Colorado — 2014–2024 history
Direct link to Colorado · Choose another state
Colorado: IEEE
| Year | With major event days | Without major event days | Loss of supply removed |
|---|---|---|---|
| 2014 | 86.7 | 81.6 | 80.9 |
| 2015 | 107.9 | 83.9 | 103 |
| 2016 | 154.5 | 83.5 | 147.2 |
| 2017 | 132.7 | 80.2 | 122.1 |
| 2018 | 99.9 | 86.5 | 96.5 |
| 2019 | 184.5 | 84.3 | 181.9 |
| 2020 | 136.4 | 83.4 | 131.5 |
| 2021 | 185.4 | 104.8 | 168.4 |
| 2022 | 143.7 | 96.9 | 138.2 |
| 2023 | 100.2 | 89.2 | 96.2 |
| 2024 | 257 | 118.9 | 251.2 |
Scroll for more →
| Year | With major event days | Without major event days | Loss of supply removed |
|---|---|---|---|
| 2014 | 0.974 | 0.956 | 0.943 |
| 2015 | 1.013 | 0.92 | 0.938 |
| 2016 | 1.168 | 0.935 | 1.008 |
| 2017 | 1.214 | 0.899 | 1.028 |
| 2018 | 0.965 | 0.915 | 0.873 |
| 2019 | 1.112 | 0.882 | 1.028 |
| 2020 | 1.032 | 0.873 | 0.957 |
| 2021 | 1.139 | 0.915 | 1.005 |
| 2022 | 1.041 | 0.923 | 0.97 |
| 2023 | 0.925 | 0.873 | 0.85 |
| 2024 | 1.415 | 1.145 | 1.335 |
Scroll for more →
| Year | With major event days | Without major event days | Loss of supply removed |
|---|---|---|---|
| 2014 | 89.1 | 85.4 | 85.8 |
| 2015 | 106.5 | 91.2 | 109.8 |
| 2016 | 132.3 | 89.3 | 146.1 |
| 2017 | 109.3 | 89.1 | 118.8 |
| 2018 | 103.6 | 94.5 | 110.5 |
| 2019 | 165.9 | 95.5 | 176.9 |
| 2020 | 132.1 | 95.5 | 137.4 |
| 2021 | 162.8 | 114.5 | 167.6 |
| 2022 | 138.1 | 105 | 142.4 |
| 2023 | 108.4 | 102.2 | 113.1 |
| 2024 | 181.6 | 103.9 | 188.1 |
Scroll for more →
Colorado: Any Method
| Year | With major event days | Without major event days |
|---|---|---|
| 2014 | 84 | 79 |
| 2015 | 110.1 | 83.4 |
| 2016 | 165.5 | 82.5 |
| 2017 | 228.5 | 78.6 |
| 2018 | 113.3 | 85.5 |
| 2019 | 180.5 | 83.6 |
| 2020 | 134.2 | 82.6 |
| 2021 | 180.9 | 102.6 |
| 2022 | 141.5 | 96.2 |
| 2023 | 99.2 | 88.4 |
| 2024 | 255.1 | 119 |
Scroll for more →
| Year | With major event days | Without major event days |
|---|---|---|
| 2014 | 0.927 | 0.909 |
| 2015 | 1.011 | 0.911 |
| 2016 | 1.155 | 0.924 |
| 2017 | 1.193 | 0.875 |
| 2018 | 0.973 | 0.897 |
| 2019 | 1.079 | 0.858 |
| 2020 | 0.998 | 0.847 |
| 2021 | 1.103 | 0.892 |
| 2022 | 1.031 | 0.917 |
| 2023 | 0.915 | 0.865 |
| 2024 | 1.409 | 1.142 |
Scroll for more →
| Year | With major event days | Without major event days |
|---|---|---|
| 2014 | 90.7 | 87 |
| 2015 | 108.9 | 91.6 |
| 2016 | 143.2 | 89.3 |
| 2017 | 191.5 | 89.8 |
| 2018 | 116.4 | 95.3 |
| 2019 | 167.3 | 97.4 |
| 2020 | 134.5 | 97.5 |
| 2021 | 164 | 115 |
| 2022 | 137.2 | 105 |
| 2023 | 108.3 | 102.2 |
| 2024 | 181 | 104.3 |
Scroll for more →
Connecticut — 2014–2024 history
Direct link to Connecticut · Choose another state
Connecticut: IEEE
| Year | With major event days | Without major event days | Loss of supply removed |
|---|---|---|---|
| 2014 | 93.7 | 93.7 | 93.6 |
| 2015 | 112.5 | 78 | 111.7 |
| 2016 | 201.1 | 103.2 | 199.6 |
| 2017 | 348.9 | 78.1 | 348.6 |
| 2018 | 761.6 | 80.9 | 759 |
| 2019 | 246.6 | 67.5 | 246.6 |
| 2020 | 3033.8 | 70.2 | 3032.5 |
| 2021 | 170.9 | 76.7 | 169.7 |
| 2022 | 187.4 | 73.7 | 187.1 |
| 2023 | 193.4 | 77.7 | 188.2 |
| 2024 | 152.8 | 73.6 | 152.3 |
Scroll for more →
| Year | With major event days | Without major event days | Loss of supply removed |
|---|---|---|---|
| 2014 | 0.777 | 0.777 | 0.777 |
| 2015 | 0.757 | 0.699 | 0.748 |
| 2016 | 1.16 | 0.993 | 1.15 |
| 2017 | 1.045 | 0.759 | 1.035 |
| 2018 | 1.286 | 0.731 | 1.256 |
| 2019 | 0.998 | 0.658 | 0.994 |
| 2020 | 1.982 | 0.691 | 1.962 |
| 2021 | 0.989 | 0.69 | 0.976 |
| 2022 | 0.905 | 0.673 | 0.897 |
| 2023 | 0.911 | 0.681 | 0.876 |
| 2024 | 0.877 | 0.649 | 0.858 |
Scroll for more →
| Year | With major event days | Without major event days | Loss of supply removed |
|---|---|---|---|
| 2014 | 120.6 | 120.6 | 120.5 |
| 2015 | 148.6 | 111.6 | 149.4 |
| 2016 | 173.4 | 103.9 | 173.5 |
| 2017 | 333.8 | 102.9 | 336.7 |
| 2018 | 592.4 | 110.7 | 604.1 |
| 2019 | 247.1 | 102.6 | 248.1 |
| 2020 | 1531 | 101.7 | 1545.5 |
| 2021 | 172.8 | 111.1 | 173.8 |
| 2022 | 207 | 109.4 | 208.5 |
| 2023 | 212.4 | 114 | 214.9 |
| 2024 | 174.3 | 113.3 | 177.4 |
Scroll for more →
Connecticut: Any Method
| Year | With major event days | Without major event days |
|---|---|---|
| 2014 | 86.3 | 86.3 |
| 2015 | 103.3 | 70.2 |
| 2016 | 174 | 92 |
| 2017 | 291.3 | 68.2 |
| 2018 | 655.5 | 75.8 |
| 2019 | 236.4 | 60.9 |
| 2020 | 2642.6 | 64.6 |
| 2021 | 145.2 | 68.6 |
| 2022 | 157.4 | 66.1 |
| 2023 | 164.6 | 70.3 |
| 2024 | 153.6 | 73.1 |
Scroll for more →
| Year | With major event days | Without major event days |
|---|---|---|
| 2014 | 0.742 | 0.742 |
| 2015 | 0.7 | 0.647 |
| 2016 | 1.063 | 0.906 |
| 2017 | 0.947 | 0.682 |
| 2018 | 1.255 | 0.705 |
| 2019 | 0.971 | 0.621 |
| 2020 | 1.827 | 0.659 |
| 2021 | 0.895 | 0.639 |
| 2022 | 0.821 | 0.621 |
| 2023 | 0.872 | 0.655 |
| 2024 | 0.876 | 0.644 |
Scroll for more →
| Year | With major event days | Without major event days |
|---|---|---|
| 2014 | 116.3 | 116.3 |
| 2015 | 147.6 | 108.4 |
| 2016 | 163.8 | 101.5 |
| 2017 | 307.7 | 100.1 |
| 2018 | 522.5 | 107.4 |
| 2019 | 243.3 | 98.2 |
| 2020 | 1446.4 | 98.1 |
| 2021 | 162.2 | 107.3 |
| 2022 | 191.8 | 106.4 |
| 2023 | 188.8 | 107.3 |
| 2024 | 175.5 | 113.4 |
Scroll for more →
Delaware — 2014–2024 history
Direct link to Delaware · Choose another state
Delaware: IEEE
| Year | With major event days | Without major event days | Loss of supply removed |
|---|---|---|---|
| 2014 | 169.8 | 113.9 | 162.7 |
| 2015 | 191.4 | 115.5 | 180 |
| 2016 | 148.7 | 102.3 | 147.3 |
| 2017 | 154.6 | 83.3 | 153.1 |
| 2018 | 136.2 | 73.8 | 135.3 |
| 2019 | 102 | 74.2 | 102 |
| 2020 | 271.9 | 84.9 | 276.1 |
| 2021 | 64.3 | 64.3 | 64.8 |
| 2022 | 79.8 | 66.4 | 80.8 |
| 2023 | 109.7 | 61.2 | 112.1 |
| 2024 | 117.9 | 66.8 | 118.9 |
Scroll for more →
| Year | With major event days | Without major event days | Loss of supply removed |
|---|---|---|---|
| 2014 | 1.414 | 1.176 | 1.331 |
| 2015 | 1.53 | 1.298 | 1.369 |
| 2016 | 1.343 | 1.147 | 1.303 |
| 2017 | 1.131 | 0.994 | 1.09 |
| 2018 | 1.037 | 0.859 | 0.98 |
| 2019 | 0.981 | 0.864 | 0.981 |
| 2020 | 1.51 | 0.951 | 1.5 |
| 2021 | 0.963 | 0.963 | 0.953 |
| 2022 | 0.853 | 0.767 | 0.864 |
| 2023 | 0.842 | 0.701 | 0.858 |
| 2024 | 0.855 | 0.727 | 0.857 |
Scroll for more →
| Year | With major event days | Without major event days | Loss of supply removed |
|---|---|---|---|
| 2014 | 120.1 | 96.9 | 122.2 |
| 2015 | 125.1 | 89 | 131.5 |
| 2016 | 110.7 | 89.2 | 113 |
| 2017 | 136.8 | 83.8 | 140.4 |
| 2018 | 131.3 | 85.9 | 138 |
| 2019 | 104 | 85.9 | 104 |
| 2020 | 180 | 89.3 | 184.1 |
| 2021 | 66.8 | 66.8 | 68 |
| 2022 | 93.5 | 86.5 | 93.4 |
| 2023 | 130.4 | 87.2 | 130.6 |
| 2024 | 138 | 91.9 | 138.7 |
Scroll for more →
Delaware: Any Method
| Year | With major event days | Without major event days |
|---|---|---|
| 2014 | 169.1 | 113.7 |
| 2015 | 189.9 | 114.7 |
| 2016 | 149.1 | 103.2 |
| 2017 | 153.9 | 83.2 |
| 2018 | 135.9 | 74.1 |
| 2019 | 101.6 | 74 |
| 2020 | 271.9 | 84.9 |
| 2021 | 64.3 | 64.3 |
| 2022 | 79.8 | 66.4 |
| 2023 | 108.2 | 60.4 |
| 2024 | 116.1 | 65.9 |
Scroll for more →
| Year | With major event days | Without major event days |
|---|---|---|
| 2014 | 1.415 | 1.179 |
| 2015 | 1.522 | 1.292 |
| 2016 | 1.35 | 1.156 |
| 2017 | 1.128 | 0.992 |
| 2018 | 1.032 | 0.856 |
| 2019 | 0.976 | 0.86 |
| 2020 | 1.51 | 0.951 |
| 2021 | 0.963 | 0.963 |
| 2022 | 0.853 | 0.767 |
| 2023 | 0.83 | 0.692 |
| 2024 | 0.843 | 0.717 |
Scroll for more →
| Year | With major event days | Without major event days |
|---|---|---|
| 2014 | 119.4 | 96.4 |
| 2015 | 124.8 | 88.8 |
| 2016 | 110.4 | 89.3 |
| 2017 | 136.5 | 83.9 |
| 2018 | 131.7 | 86.5 |
| 2019 | 104 | 86 |
| 2020 | 180 | 89.3 |
| 2021 | 66.8 | 66.8 |
| 2022 | 93.5 | 86.5 |
| 2023 | 130.3 | 87.3 |
| 2024 | 137.8 | 91.9 |
Scroll for more →
District of Columbia — 2014–2024 history
Direct link to District of Columbia · Choose another state
District of Columbia: IEEE
| Year | With major event days | Without major event days | Loss of supply removed |
|---|---|---|---|
| 2014 | 96 | 82 | 96 |
| 2015 | 112.4 | 112.4 | 112.4 |
| 2016 | 115 | 115 | 115 |
| 2017 | 57.5 | 57.5 | 57.5 |
| 2018 | 109.2 | 52.9 | 109.2 |
| 2019 | 77 | 55 | 77 |
| 2020 | 44 | 39 | 44 |
| 2021 | 52 | 42 | 52 |
| 2022 | 33.7 | 26.3 | 33.7 |
| 2023 | 71.9 | 33.3 | 71.9 |
| 2024 | 32.6 | 26.4 | 32.6 |
Scroll for more →
| Year | With major event days | Without major event days | Loss of supply removed |
|---|---|---|---|
| 2014 | 0.69 | 0.64 | 0.69 |
| 2015 | 0.686 | 0.686 | 0.686 |
| 2016 | 0.82 | 0.82 | 0.82 |
| 2017 | 0.553 | 0.553 | 0.55 |
| 2018 | 0.643 | 0.538 | 0.643 |
| 2019 | 0.59 | 0.49 | 0.59 |
| 2020 | 0.4 | 0.37 | 0.4 |
| 2021 | 0.45 | 0.41 | 0.45 |
| 2022 | 0.302 | 0.277 | 0.302 |
| 2023 | 0.37 | 0.318 | 0.37 |
| 2024 | 0.271 | 0.246 | 0.271 |
Scroll for more →
| Year | With major event days | Without major event days | Loss of supply removed |
|---|---|---|---|
| 2014 | 139.1 | 128.1 | 139.1 |
| 2015 | 163.9 | 163.9 | 163.9 |
| 2016 | 140.2 | 140.2 | 140.2 |
| 2017 | 104 | 104 | 104.6 |
| 2018 | 169.9 | 98.3 | 169.9 |
| 2019 | 130.5 | 112.2 | 130.5 |
| 2020 | 110 | 105.4 | 110 |
| 2021 | 115.6 | 102.4 | 115.6 |
| 2022 | 111.5 | 95.1 | 111.5 |
| 2023 | 194.2 | 104.6 | 194.2 |
| 2024 | 120.2 | 107.2 | 120.2 |
Scroll for more →
District of Columbia: Any Method
| Year | With major event days | Without major event days |
|---|---|---|
| 2014 | 96 | 82 |
| 2015 | 112.4 | 112.4 |
| 2016 | 115 | 115 |
| 2017 | 57.5 | 57.5 |
| 2018 | 109.2 | 52.9 |
| 2019 | 77 | 55 |
| 2020 | 44 | 39 |
| 2021 | 52 | 42 |
| 2022 | 33.7 | 26.3 |
| 2023 | 71.9 | 33.3 |
| 2024 | 32.6 | 26.4 |
Scroll for more →
| Year | With major event days | Without major event days |
|---|---|---|
| 2014 | 0.69 | 0.64 |
| 2015 | 0.686 | 0.686 |
| 2016 | 0.82 | 0.82 |
| 2017 | 0.553 | 0.553 |
| 2018 | 0.643 | 0.538 |
| 2019 | 0.59 | 0.49 |
| 2020 | 0.4 | 0.37 |
| 2021 | 0.45 | 0.41 |
| 2022 | 0.302 | 0.277 |
| 2023 | 0.37 | 0.318 |
| 2024 | 0.271 | 0.246 |
Scroll for more →
| Year | With major event days | Without major event days |
|---|---|---|
| 2014 | 139.1 | 128.1 |
| 2015 | 163.9 | 163.9 |
| 2016 | 140.2 | 140.2 |
| 2017 | 104 | 104 |
| 2018 | 169.9 | 98.3 |
| 2019 | 130.5 | 112.2 |
| 2020 | 110 | 105.4 |
| 2021 | 115.6 | 102.4 |
| 2022 | 111.5 | 95.1 |
| 2023 | 194.2 | 104.6 |
| 2024 | 120.2 | 107.2 |
Scroll for more →
Florida — 2014–2024 history
Direct link to Florida · Choose another state
Florida: IEEE
| Year | With major event days | Without major event days | Loss of supply removed |
|---|---|---|---|
| 2014 | 89.4 | 86.6 | 122.4 |
| 2015 | 86.1 | 79.3 | 80.3 |
| 2016 | 388.2 | 82.7 | 387 |
| 2017 | 2693.2 | 76.7 | 2666.6 |
| 2018 | 305.5 | 79.6 | 302.8 |
| 2019 | 88.9 | 74 | 83.2 |
| 2020 | 200.4 | 72.5 | 194.9 |
| 2021 | 82.9 | 65.3 | 77.2 |
| 2022 | 1011.3 | 69.8 | 1012.6 |
| 2023 | 172.3 | 69.4 | 160 |
| 2024 | 1487.6 | 66.7 | 1485.6 |
Scroll for more →
| Year | With major event days | Without major event days | Loss of supply removed |
|---|---|---|---|
| 2014 | 1.134 | 1.105 | 1.5 |
| 2015 | 1.096 | 1.041 | 1.014 |
| 2016 | 1.372 | 1.051 | 1.278 |
| 2017 | 2.068 | 1 | 1.993 |
| 2018 | 1.112 | 0.953 | 1.095 |
| 2019 | 0.985 | 0.906 | 0.919 |
| 2020 | 1.139 | 0.893 | 1.058 |
| 2021 | 0.901 | 0.796 | 0.859 |
| 2022 | 1.463 | 0.833 | 1.408 |
| 2023 | 0.982 | 0.78 | 0.929 |
| 2024 | 1.784 | 0.741 | 1.716 |
Scroll for more →
| Year | With major event days | Without major event days | Loss of supply removed |
|---|---|---|---|
| 2014 | 78.9 | 78.4 | 81.6 |
| 2015 | 78.6 | 76.2 | 79.1 |
| 2016 | 282.9 | 78.7 | 302.9 |
| 2017 | 1302.1 | 76.8 | 1337.8 |
| 2018 | 274.7 | 83.5 | 276.5 |
| 2019 | 90.3 | 81.8 | 90.5 |
| 2020 | 175.9 | 81.2 | 184.2 |
| 2021 | 92 | 82 | 89.9 |
| 2022 | 691.2 | 83.8 | 719.3 |
| 2023 | 175.5 | 89 | 172.3 |
| 2024 | 833.9 | 90 | 865.9 |
Scroll for more →
Florida: Any Method
| Year | With major event days | Without major event days |
|---|---|---|
| 2014 | 92.1 | 85.5 |
| 2015 | 85.4 | 77.9 |
| 2016 | 352.1 | 81.8 |
| 2017 | 2504.2 | 78.6 |
| 2018 | 325.4 | 77.4 |
| 2019 | 89 | 74.2 |
| 2020 | 188.7 | 73 |
| 2021 | 80.8 | 64.8 |
| 2022 | 1146.3 | 69.7 |
| 2023 | 160.1 | 69.2 |
| 2024 | 1321.5 | 66.4 |
Scroll for more →
| Year | With major event days | Without major event days |
|---|---|---|
| 2014 | 1.148 | 1.136 |
| 2015 | 1.091 | 1.06 |
| 2016 | 1.357 | 1.073 |
| 2017 | 2.017 | 1.04 |
| 2018 | 1.129 | 0.972 |
| 2019 | 1.012 | 0.939 |
| 2020 | 1.171 | 0.952 |
| 2021 | 0.929 | 0.834 |
| 2022 | 1.48 | 0.866 |
| 2023 | 1.015 | 0.823 |
| 2024 | 1.77 | 0.762 |
Scroll for more →
| Year | With major event days | Without major event days |
|---|---|---|
| 2014 | 80.2 | 75.2 |
| 2015 | 78.3 | 73.6 |
| 2016 | 259.4 | 76.3 |
| 2017 | 1241.6 | 75.5 |
| 2018 | 288.2 | 79.7 |
| 2019 | 87.9 | 79.1 |
| 2020 | 161.2 | 76.7 |
| 2021 | 87 | 77.7 |
| 2022 | 774.5 | 80.4 |
| 2023 | 157.7 | 84.1 |
| 2024 | 746.6 | 87.1 |
Scroll for more →
Georgia — 2014–2024 history
Direct link to Georgia · Choose another state
Georgia: IEEE
| Year | With major event days | Without major event days | Loss of supply removed |
|---|---|---|---|
| 2014 | 252.3 | 97.8 | 210.7 |
| 2015 | 248.2 | 108.5 | 355.1 |
| 2016 | 424 | 120.6 | 177.8 |
| 2017 | 1030.8 | 115.2 | 906.4 |
| 2018 | 230.7 | 118.8 | 238.9 |
| 2019 | 149.8 | 125.8 | 117.2 |
| 2020 | 521.7 | 130.5 | 509.8 |
| 2021 | 140.5 | 123.8 | 122.9 |
| 2022 | 212.4 | 129.3 | 185.2 |
| 2023 | 342.7 | 133.4 | 300.3 |
| 2024 | 1208.1 | 211.4 | 768 |
Scroll for more →
| Year | With major event days | Without major event days | Loss of supply removed |
|---|---|---|---|
| 2014 | 1.53 | 1.179 | 1.29 |
| 2015 | 1.563 | 1.279 | 1.4 |
| 2016 | 1.525 | 1.34 | 1.241 |
| 2017 | 2.214 | 1.189 | 2.064 |
| 2018 | 1.542 | 1.248 | 1.423 |
| 2019 | 1.361 | 1.222 | 1.235 |
| 2020 | 1.952 | 1.328 | 1.746 |
| 2021 | 1.291 | 1.241 | 1.149 |
| 2022 | 1.668 | 1.291 | 1.544 |
| 2023 | 1.858 | 1.336 | 1.765 |
| 2024 | 2.104 | 1.244 | 1.905 |
Scroll for more →
| Year | With major event days | Without major event days | Loss of supply removed |
|---|---|---|---|
| 2014 | 165 | 83 | 163.3 |
| 2015 | 158.9 | 84.8 | 253.6 |
| 2016 | 278.1 | 90.1 | 143.2 |
| 2017 | 465.6 | 96.9 | 439.1 |
| 2018 | 149.7 | 95.2 | 167.9 |
| 2019 | 110.1 | 103 | 94.9 |
| 2020 | 267.2 | 98.3 | 291.9 |
| 2021 | 108.9 | 99.8 | 106.9 |
| 2022 | 127.3 | 100.2 | 119.9 |
| 2023 | 184.5 | 99.9 | 170.1 |
| 2024 | 574.3 | 170 | 403.2 |
Scroll for more →
Georgia: Any Method
| Year | With major event days | Without major event days |
|---|---|---|
| 2014 | 246.3 | 99.1 |
| 2015 | 243.7 | 109.1 |
| 2016 | 424.4 | 134.5 |
| 2017 | 1049.2 | 122.1 |
| 2018 | 373.2 | 122.5 |
| 2019 | 152.3 | 127.7 |
| 2020 | 509.9 | 133.3 |
| 2021 | 145.8 | 129.4 |
| 2022 | 264.3 | 134.6 |
| 2023 | 349.2 | 136.8 |
| 2024 | 1229.1 | 212.3 |
Scroll for more →
| Year | With major event days | Without major event days |
|---|---|---|
| 2014 | 1.508 | 1.169 |
| 2015 | 1.539 | 1.265 |
| 2016 | 1.526 | 1.342 |
| 2017 | 2.449 | 1.199 |
| 2018 | 1.557 | 1.257 |
| 2019 | 1.382 | 1.241 |
| 2020 | 1.964 | 1.36 |
| 2021 | 1.317 | 1.268 |
| 2022 | 1.695 | 1.316 |
| 2023 | 1.885 | 1.357 |
| 2024 | 2.122 | 1.264 |
Scroll for more →
| Year | With major event days | Without major event days |
|---|---|---|
| 2014 | 163.3 | 84.8 |
| 2015 | 158.4 | 86.2 |
| 2016 | 278.1 | 100.2 |
| 2017 | 428.3 | 101.8 |
| 2018 | 239.7 | 97.5 |
| 2019 | 110.2 | 102.9 |
| 2020 | 259.6 | 98 |
| 2021 | 110.7 | 102 |
| 2022 | 155.9 | 102.3 |
| 2023 | 185.2 | 100.8 |
| 2024 | 579.2 | 168 |
Scroll for more →
Hawaii — 2014–2024 history
Direct link to Hawaii · Choose another state
EIA publishes genuine zero for Hawaii 2024 IEEE loss-of-supply-removed SAIDI and SAIFI; CAIDI is UNKNOWN. Zero is an observed source value, not a missing value.
Hawaii: IEEE
| Year | With major event days | Without major event days | Loss of supply removed |
|---|---|---|---|
| 2014 | UNKNOWN | UNKNOWN | UNKNOWN |
| 2015 | 152 | 99.4 | UNKNOWN |
| 2016 | 109.3 | 83.2 | 98.9 |
| 2017 | 254.3 | 112 | 252.7 |
| 2018 | 198 | 151.9 | 188.7 |
| 2019 | 182.1 | 113.4 | 164.8 |
| 2020 | 123.8 | 97.3 | 118 |
| 2021 | UNKNOWN | UNKNOWN | UNKNOWN |
| 2022 | UNKNOWN | UNKNOWN | UNKNOWN |
| 2023 | 248.8 | UNKNOWN | UNKNOWN |
| 2024 | 382.6 | 219.3 | 0 |
Scroll for more →
| Year | With major event days | Without major event days | Loss of supply removed |
|---|---|---|---|
| 2014 | UNKNOWN | UNKNOWN | UNKNOWN |
| 2015 | 1.911 | 1.454 | UNKNOWN |
| 2016 | 1.3 | 1.002 | 1.049 |
| 2017 | 1.794 | 1.295 | 1.657 |
| 2018 | 1.867 | 1.688 | 1.549 |
| 2019 | 1.64 | 1.192 | 1.387 |
| 2020 | 1.207 | 1.112 | 0.975 |
| 2021 | UNKNOWN | UNKNOWN | UNKNOWN |
| 2022 | UNKNOWN | UNKNOWN | UNKNOWN |
| 2023 | 3.922 | UNKNOWN | UNKNOWN |
| 2024 | 4.39 | 2.39 | 0 |
Scroll for more →
| Year | With major event days | Without major event days | Loss of supply removed |
|---|---|---|---|
| 2014 | UNKNOWN | UNKNOWN | UNKNOWN |
| 2015 | 79.6 | 68.4 | UNKNOWN |
| 2016 | 84.1 | 83.1 | 94.2 |
| 2017 | 141.7 | 86.5 | 152.5 |
| 2018 | 106.1 | 90 | 121.8 |
| 2019 | 111 | 95.1 | 118.8 |
| 2020 | 102.5 | 87.5 | 121 |
| 2021 | UNKNOWN | UNKNOWN | UNKNOWN |
| 2022 | UNKNOWN | UNKNOWN | UNKNOWN |
| 2023 | 63.4 | UNKNOWN | UNKNOWN |
| 2024 | 87.2 | 91.8 | UNKNOWN |
Scroll for more →
Hawaii: Any Method
| Year | With major event days | Without major event days |
|---|---|---|
| 2014 | 262.5 | 117 |
| 2015 | 266.1 | 116.7 |
| 2016 | 128.7 | 103.9 |
| 2017 | 252.3 | 112 |
| 2018 | 191.4 | 151.9 |
| 2019 | 195.2 | 113.4 |
| 2020 | 118.7 | 97.3 |
| 2021 | 229.7 | 115.7 |
| 2022 | 187.2 | 105.9 |
| 2023 | 491.8 | 148.6 |
| 2024 | 320.6 | 225.6 |
Scroll for more →
| Year | With major event days | Without major event days |
|---|---|---|
| 2014 | 2.307 | 1.845 |
| 2015 | 2.986 | 1.711 |
| 2016 | 1.897 | 1.444 |
| 2017 | 2.092 | 1.295 |
| 2018 | 1.959 | 1.688 |
| 2019 | 2.05 | 1.192 |
| 2020 | 1.217 | 1.112 |
| 2021 | 1.6 | 1.199 |
| 2022 | 1.647 | 1.195 |
| 2023 | 1.788 | 1.398 |
| 2024 | 2.616 | 2.18 |
Scroll for more →
| Year | With major event days | Without major event days |
|---|---|---|
| 2014 | 113.8 | 63.4 |
| 2015 | 89.1 | 68.2 |
| 2016 | 67.9 | 71.9 |
| 2017 | 120.6 | 86.5 |
| 2018 | 97.7 | 90 |
| 2019 | 95.2 | 95.1 |
| 2020 | 97.5 | 87.5 |
| 2021 | 143.5 | 96.5 |
| 2022 | 113.7 | 88.6 |
| 2023 | 275.1 | 106.3 |
| 2024 | 122.6 | 103.5 |
Scroll for more →
Idaho — 2014–2024 history
Direct link to Idaho · Choose another state
Idaho: IEEE
| Year | With major event days | Without major event days | Loss of supply removed |
|---|---|---|---|
| 2014 | 168.4 | 139.9 | 145.9 |
| 2015 | 238.1 | 193.2 | 204.2 |
| 2016 | 183 | 157.6 | 174 |
| 2017 | 253.9 | 223.9 | 239 |
| 2018 | 169.9 | 140.8 | 155.7 |
| 2019 | 155.4 | 132.3 | 122.9 |
| 2020 | 286.5 | 158.1 | 173.6 |
| 2021 | 438 | 137.5 | 223.8 |
| 2022 | 167.4 | 144.5 | 112.7 |
| 2023 | 134.4 | 121.8 | 95.9 |
| 2024 | 204.4 | 152.5 | 150.5 |
Scroll for more →
| Year | With major event days | Without major event days | Loss of supply removed |
|---|---|---|---|
| 2014 | 1.266 | 1.148 | 1.116 |
| 2015 | 1.668 | 1.418 | 1.455 |
| 2016 | 1.338 | 1.16 | 1.231 |
| 2017 | 1.697 | 1.615 | 1.574 |
| 2018 | 1.198 | 1.094 | 1.096 |
| 2019 | 1.243 | 1.144 | 0.961 |
| 2020 | 1.589 | 1.211 | 1.173 |
| 2021 | 1.779 | 1.235 | 1.222 |
| 2022 | 1.168 | 1.091 | 0.815 |
| 2023 | 1.071 | 0.985 | 0.757 |
| 2024 | 1.314 | 1.136 | 0.959 |
Scroll for more →
| Year | With major event days | Without major event days | Loss of supply removed |
|---|---|---|---|
| 2014 | 133 | 121.9 | 130.7 |
| 2015 | 142.7 | 136.3 | 140.4 |
| 2016 | 136.8 | 135.9 | 141.4 |
| 2017 | 149.7 | 138.6 | 151.8 |
| 2018 | 141.8 | 128.7 | 142.1 |
| 2019 | 125 | 115.7 | 127.9 |
| 2020 | 180.3 | 130.5 | 148 |
| 2021 | 246.2 | 111.4 | 183.1 |
| 2022 | 143.4 | 132.5 | 138.3 |
| 2023 | 125.5 | 123.6 | 126.7 |
| 2024 | 155.5 | 134.2 | 157.1 |
Scroll for more →
Idaho: Any Method
| Year | With major event days | Without major event days |
|---|---|---|
| 2014 | 245.2 | 183.8 |
| 2015 | 465.3 | 266.4 |
| 2016 | 197.2 | 166 |
| 2017 | 313.8 | 248.5 |
| 2018 | 174.1 | 144.9 |
| 2019 | 166.6 | 143.9 |
| 2020 | 324.9 | 180.7 |
| 2021 | 475.2 | 162.1 |
| 2022 | 180.7 | 158.3 |
| 2023 | 137.5 | 119.4 |
| 2024 | 232.8 | 174 |
Scroll for more →
| Year | With major event days | Without major event days |
|---|---|---|
| 2014 | 1.287 | 1.156 |
| 2015 | 1.744 | 1.424 |
| 2016 | 1.351 | 1.179 |
| 2017 | 1.693 | 1.615 |
| 2018 | 1.198 | 1.094 |
| 2019 | 1.243 | 1.144 |
| 2020 | 1.589 | 1.211 |
| 2021 | 1.779 | 1.235 |
| 2022 | 1.168 | 1.091 |
| 2023 | 1.071 | 0.985 |
| 2024 | 1.314 | 1.136 |
Scroll for more →
| Year | With major event days | Without major event days |
|---|---|---|
| 2014 | 190.6 | 159.1 |
| 2015 | 266.9 | 187.1 |
| 2016 | 145.9 | 140.8 |
| 2017 | 185.3 | 153.9 |
| 2018 | 145.3 | 132.4 |
| 2019 | 134.1 | 125.8 |
| 2020 | 204.5 | 149.1 |
| 2021 | 267.1 | 131.3 |
| 2022 | 154.8 | 145.1 |
| 2023 | 128.4 | 121.2 |
| 2024 | 177.1 | 153.2 |
Scroll for more →
Illinois — 2014–2024 history
Direct link to Illinois · Choose another state
Illinois: IEEE
| Year | With major event days | Without major event days | Loss of supply removed |
|---|---|---|---|
| 2014 | 197.6 | 91.9 | 197.3 |
| 2015 | 170.9 | 88.4 | 168.1 |
| 2016 | 136.1 | 80.7 | 133 |
| 2017 | 120 | 72.8 | 117.1 |
| 2018 | 143.8 | 72.5 | 140.5 |
| 2019 | 116.3 | 73.8 | 110.3 |
| 2020 | 335.6 | 57.1 | 333.9 |
| 2021 | 127.3 | 63.6 | 125.6 |
| 2022 | 90.8 | 59.1 | 89.2 |
| 2023 | 210.4 | 56.2 | 209.9 |
| 2024 | 158 | 59.1 | 154.7 |
Scroll for more →
| Year | With major event days | Without major event days | Loss of supply removed |
|---|---|---|---|
| 2014 | 1.124 | 0.95 | 1.105 |
| 2015 | 1.112 | 0.937 | 1.072 |
| 2016 | 1.016 | 0.83 | 0.999 |
| 2017 | 0.921 | 0.749 | 0.9 |
| 2018 | 0.912 | 0.777 | 0.887 |
| 2019 | 0.923 | 0.762 | 0.906 |
| 2020 | 0.925 | 0.653 | 0.903 |
| 2021 | 0.901 | 0.704 | 0.876 |
| 2022 | 0.756 | 0.643 | 0.745 |
| 2023 | 0.833 | 0.604 | 0.819 |
| 2024 | 0.848 | 0.637 | 0.815 |
Scroll for more →
| Year | With major event days | Without major event days | Loss of supply removed |
|---|---|---|---|
| 2014 | 175.8 | 96.8 | 178.5 |
| 2015 | 153.7 | 94.3 | 156.7 |
| 2016 | 134 | 97.2 | 133.2 |
| 2017 | 130.2 | 97.3 | 130.2 |
| 2018 | 157.7 | 93.3 | 158.5 |
| 2019 | 126.1 | 96.8 | 121.7 |
| 2020 | 362.7 | 87.5 | 369.8 |
| 2021 | 141.2 | 90.4 | 143.3 |
| 2022 | 120.2 | 91.9 | 119.8 |
| 2023 | 252.4 | 93 | 256.4 |
| 2024 | 186.3 | 92.7 | 189.9 |
Scroll for more →
Illinois: Any Method
| Year | With major event days | Without major event days |
|---|---|---|
| 2014 | 195.7 | 92.5 |
| 2015 | 169.3 | 88.8 |
| 2016 | 134.9 | 80.8 |
| 2017 | 119.7 | 73.3 |
| 2018 | 142.9 | 72.6 |
| 2019 | 116.2 | 73.9 |
| 2020 | 331.1 | 57.1 |
| 2021 | 127 | 63.5 |
| 2022 | 90.4 | 59 |
| 2023 | 208.2 | 56.2 |
| 2024 | 156.9 | 59.4 |
Scroll for more →
| Year | With major event days | Without major event days |
|---|---|---|
| 2014 | 1.126 | 0.954 |
| 2015 | 1.111 | 0.94 |
| 2016 | 1.023 | 0.831 |
| 2017 | 0.926 | 0.754 |
| 2018 | 0.916 | 0.779 |
| 2019 | 0.926 | 0.763 |
| 2020 | 0.924 | 0.654 |
| 2021 | 0.907 | 0.702 |
| 2022 | 0.761 | 0.645 |
| 2023 | 0.835 | 0.605 |
| 2024 | 0.852 | 0.644 |
Scroll for more →
| Year | With major event days | Without major event days |
|---|---|---|
| 2014 | 173.9 | 96.9 |
| 2015 | 152.4 | 94.4 |
| 2016 | 132 | 97.2 |
| 2017 | 129.3 | 97.2 |
| 2018 | 156 | 93.3 |
| 2019 | 125.5 | 96.8 |
| 2020 | 358.4 | 87.3 |
| 2021 | 140.1 | 90.4 |
| 2022 | 118.9 | 91.4 |
| 2023 | 249.2 | 92.9 |
| 2024 | 184 | 92.3 |
Scroll for more →
Indiana — 2014–2024 history
Direct link to Indiana · Choose another state
Indiana: IEEE
| Year | With major event days | Without major event days | Loss of supply removed |
|---|---|---|---|
| 2014 | 236.5 | 122.2 | 218.7 |
| 2015 | 257.4 | 119.7 | 244 |
| 2016 | 254.2 | 129.4 | 234.4 |
| 2017 | 223.5 | 135.4 | 197.5 |
| 2018 | 302.4 | 146.1 | 263 |
| 2019 | 266.6 | 147.5 | 217.4 |
| 2020 | 294.3 | 127.6 | 205.1 |
| 2021 | 302.7 | 137.4 | 225.2 |
| 2022 | 276.5 | 139.9 | 217.6 |
| 2023 | 467.4 | 111.3 | 462.1 |
| 2024 | 310 | 123.3 | 252.3 |
Scroll for more →
| Year | With major event days | Without major event days | Loss of supply removed |
|---|---|---|---|
| 2014 | 1.258 | 1.047 | 1.107 |
| 2015 | 1.294 | 1.041 | 1.142 |
| 2016 | 1.347 | 1.064 | 1.16 |
| 2017 | 1.313 | 1.045 | 1.136 |
| 2018 | 1.493 | 1.153 | 1.232 |
| 2019 | 1.524 | 1.171 | 1.248 |
| 2020 | 1.31 | 1.005 | 1.011 |
| 2021 | 1.39 | 1.077 | 1.141 |
| 2022 | 1.427 | 1.136 | 1.229 |
| 2023 | 1.414 | 0.944 | 1.292 |
| 2024 | 1.276 | 1.008 | 1.14 |
Scroll for more →
| Year | With major event days | Without major event days | Loss of supply removed |
|---|---|---|---|
| 2014 | 188 | 116.8 | 197.6 |
| 2015 | 198.9 | 115 | 213.7 |
| 2016 | 188.7 | 121.6 | 202.1 |
| 2017 | 170.2 | 129.6 | 173.9 |
| 2018 | 202.6 | 126.7 | 213.5 |
| 2019 | 174.9 | 125.9 | 174.2 |
| 2020 | 224.7 | 127 | 202.9 |
| 2021 | 217.8 | 127.5 | 197.5 |
| 2022 | 193.7 | 123.2 | 177 |
| 2023 | 330.6 | 118 | 357.6 |
| 2024 | 242.9 | 122.4 | 221.4 |
Scroll for more →
Indiana: Any Method
| Year | With major event days | Without major event days |
|---|---|---|
| 2014 | 239.9 | 120.5 |
| 2015 | 244 | 120.1 |
| 2016 | 252.5 | 127.4 |
| 2017 | 212.4 | 131.1 |
| 2018 | 285.9 | 142 |
| 2019 | 260.6 | 146.2 |
| 2020 | 280.1 | 124.8 |
| 2021 | 285.8 | 133.1 |
| 2022 | 279.3 | 137.4 |
| 2023 | 455.4 | 110.3 |
| 2024 | 312.4 | 121.4 |
Scroll for more →
| Year | With major event days | Without major event days |
|---|---|---|
| 2014 | 1.28 | 1.049 |
| 2015 | 1.263 | 1.022 |
| 2016 | 1.336 | 1.048 |
| 2017 | 1.27 | 1.01 |
| 2018 | 1.457 | 1.133 |
| 2019 | 1.503 | 1.17 |
| 2020 | 1.289 | 0.996 |
| 2021 | 1.358 | 1.06 |
| 2022 | 1.431 | 1.123 |
| 2023 | 1.447 | 0.946 |
| 2024 | 1.283 | 0.997 |
Scroll for more →
| Year | With major event days | Without major event days |
|---|---|---|
| 2014 | 187.5 | 114.9 |
| 2015 | 193.3 | 117.6 |
| 2016 | 189.1 | 121.6 |
| 2017 | 167.3 | 129.8 |
| 2018 | 196.3 | 125.4 |
| 2019 | 173.4 | 125 |
| 2020 | 217.3 | 125.3 |
| 2021 | 210.5 | 125.5 |
| 2022 | 195.3 | 122.4 |
| 2023 | 314.8 | 116.6 |
| 2024 | 243.5 | 121.8 |
Scroll for more →
Iowa — 2014–2024 history
Direct link to Iowa · Choose another state
Iowa: IEEE
| Year | With major event days | Without major event days | Loss of supply removed |
|---|---|---|---|
| 2014 | 151.3 | 91.1 | 136.3 |
| 2015 | 96 | 88.1 | 85.7 |
| 2016 | 136.5 | 96 | 122.5 |
| 2017 | 128.1 | 103.8 | 109.7 |
| 2018 | 115.4 | 92.9 | 102.8 |
| 2019 | 126 | 83.7 | 111 |
| 2020 | 1066.5 | 85.7 | 1053 |
| 2021 | 137.8 | 80.7 | 115.7 |
| 2022 | 95 | 78.2 | 80.1 |
| 2023 | 83.9 | 60.7 | 75.5 |
| 2024 | 200.3 | 84.1 | 187 |
Scroll for more →
| Year | With major event days | Without major event days | Loss of supply removed |
|---|---|---|---|
| 2014 | 1.224 | 0.993 | 1.06 |
| 2015 | 0.997 | 0.963 | 0.849 |
| 2016 | 1.166 | 0.99 | 0.897 |
| 2017 | 1.073 | 0.968 | 0.851 |
| 2018 | 1.021 | 0.933 | 0.851 |
| 2019 | 1.128 | 0.936 | 0.961 |
| 2020 | 1.489 | 0.864 | 1.341 |
| 2021 | 0.959 | 0.812 | 0.78 |
| 2022 | 0.978 | 0.837 | 0.76 |
| 2023 | 0.859 | 0.645 | 0.741 |
| 2024 | 1.213 | 0.811 | 1.043 |
Scroll for more →
| Year | With major event days | Without major event days | Loss of supply removed |
|---|---|---|---|
| 2014 | 123.6 | 91.8 | 128.6 |
| 2015 | 96.2 | 91.5 | 101 |
| 2016 | 117.1 | 97 | 136.6 |
| 2017 | 119.4 | 107.2 | 129 |
| 2018 | 112.9 | 99.5 | 120.7 |
| 2019 | 111.7 | 89.4 | 115.5 |
| 2020 | 716.5 | 99.1 | 785.4 |
| 2021 | 143.6 | 99.4 | 148.3 |
| 2022 | 97.2 | 93.5 | 105.4 |
| 2023 | 97.7 | 94.1 | 101.9 |
| 2024 | 165.1 | 103.6 | 179.3 |
Scroll for more →
Iowa: Any Method
| Year | With major event days | Without major event days |
|---|---|---|
| 2014 | 164.7 | 93.4 |
| 2015 | 96.8 | 85.5 |
| 2016 | 117.7 | 92 |
| 2017 | 119 | 95.2 |
| 2018 | 126.8 | 92.6 |
| 2019 | 122.8 | 89.8 |
| 2020 | 1758.7 | 87.9 |
| 2021 | 133.1 | 79.5 |
| 2022 | 85.8 | 75.5 |
| 2023 | 104.9 | 70.4 |
| 2024 | 166.7 | 89.8 |
Scroll for more →
| Year | With major event days | Without major event days |
|---|---|---|
| 2014 | 1.201 | 0.992 |
| 2015 | 0.964 | 0.924 |
| 2016 | 1.049 | 0.937 |
| 2017 | 1.002 | 0.907 |
| 2018 | 1.015 | 0.938 |
| 2019 | 1.08 | 0.947 |
| 2020 | 1.487 | 0.849 |
| 2021 | 0.923 | 0.805 |
| 2022 | 0.888 | 0.809 |
| 2023 | 0.907 | 0.709 |
| 2024 | 1.15 | 0.887 |
Scroll for more →
| Year | With major event days | Without major event days |
|---|---|---|
| 2014 | 137.2 | 94.2 |
| 2015 | 100.4 | 92.5 |
| 2016 | 112.1 | 98.2 |
| 2017 | 118.8 | 104.9 |
| 2018 | 125 | 98.7 |
| 2019 | 113.7 | 94.9 |
| 2020 | 1183.1 | 103.5 |
| 2021 | 144.1 | 98.8 |
| 2022 | 96.6 | 93.3 |
| 2023 | 115.7 | 99.3 |
| 2024 | 145 | 101.3 |
Scroll for more →
Kansas — 2014–2024 history
Direct link to Kansas · Choose another state
Kansas: IEEE
| Year | With major event days | Without major event days | Loss of supply removed |
|---|---|---|---|
| 2014 | 153.4 | 114.9 | 138.5 |
| 2015 | 350.5 | 131.5 | 242.1 |
| 2016 | 169.1 | 132.3 | 151.4 |
| 2017 | 368.6 | 130.9 | 359.5 |
| 2018 | 151.3 | 105.6 | 140 |
| 2019 | 241.2 | 117.2 | 266.1 |
| 2020 | 106.6 | 91.8 | 100.7 |
| 2021 | 346 | 113.9 | 327.9 |
| 2022 | 178.3 | 108.1 | 157.9 |
| 2023 | 287.1 | 101.8 | 274.4 |
| 2024 | 289.8 | 104 | 277.9 |
Scroll for more →
| Year | With major event days | Without major event days | Loss of supply removed |
|---|---|---|---|
| 2014 | 1.354 | 1.207 | 1.217 |
| 2015 | 1.629 | 1.306 | 1.39 |
| 2016 | 1.423 | 1.238 | 1.281 |
| 2017 | 1.488 | 1.145 | 1.248 |
| 2018 | 1.163 | 0.986 | 1.007 |
| 2019 | 1.361 | 1.028 | 1.342 |
| 2020 | 0.945 | 0.89 | 0.91 |
| 2021 | 1.537 | 1.064 | 1.346 |
| 2022 | 1.321 | 1.087 | 1.143 |
| 2023 | 1.327 | 1.004 | 1.171 |
| 2024 | 1.503 | 1.005 | 1.35 |
Scroll for more →
| Year | With major event days | Without major event days | Loss of supply removed |
|---|---|---|---|
| 2014 | 113.3 | 95.2 | 113.7 |
| 2015 | 215.2 | 100.7 | 174.2 |
| 2016 | 118.8 | 106.8 | 118.2 |
| 2017 | 247.7 | 114.3 | 288.1 |
| 2018 | 130.1 | 107.1 | 139.1 |
| 2019 | 177.2 | 114 | 198.3 |
| 2020 | 112.8 | 103.2 | 110.7 |
| 2021 | 225.1 | 107.1 | 243.6 |
| 2022 | 134.9 | 99.5 | 138.2 |
| 2023 | 216.3 | 101.4 | 234.3 |
| 2024 | 192.8 | 103.5 | 205.9 |
Scroll for more →
Kansas: Any Method
| Year | With major event days | Without major event days |
|---|---|---|
| 2014 | 152.4 | 114.9 |
| 2015 | 347.3 | 130.7 |
| 2016 | 167.8 | 131.9 |
| 2017 | 364.8 | 131 |
| 2018 | 154.8 | 108.9 |
| 2019 | 240 | 117.3 |
| 2020 | 107.1 | 92.3 |
| 2021 | 341.5 | 113 |
| 2022 | 178.8 | 108.1 |
| 2023 | 283.1 | 101.7 |
| 2024 | 285.6 | 103.6 |
Scroll for more →
| Year | With major event days | Without major event days |
|---|---|---|
| 2014 | 1.348 | 1.21 |
| 2015 | 1.629 | 1.312 |
| 2016 | 1.408 | 1.231 |
| 2017 | 1.481 | 1.145 |
| 2018 | 1.168 | 0.988 |
| 2019 | 1.368 | 1.034 |
| 2020 | 0.945 | 0.886 |
| 2021 | 1.534 | 1.059 |
| 2022 | 1.321 | 1.086 |
| 2023 | 1.318 | 0.998 |
| 2024 | 1.506 | 1.003 |
Scroll for more →
| Year | With major event days | Without major event days |
|---|---|---|
| 2014 | 113 | 95 |
| 2015 | 213.3 | 99.6 |
| 2016 | 119.1 | 107.1 |
| 2017 | 246.3 | 114.4 |
| 2018 | 132.6 | 110.2 |
| 2019 | 175.4 | 113.4 |
| 2020 | 113.3 | 104.2 |
| 2021 | 222.7 | 106.8 |
| 2022 | 135.4 | 99.5 |
| 2023 | 214.9 | 101.9 |
| 2024 | 189.7 | 103.3 |
Scroll for more →
Kentucky — 2014–2024 history
Direct link to Kentucky · Choose another state
Kentucky: IEEE
| Year | With major event days | Without major event days | Loss of supply removed |
|---|---|---|---|
| 2014 | 249.5 | 146.7 | 233.4 |
| 2015 | 245.8 | 140.4 | 232 |
| 2016 | 194.3 | 139 | 183.9 |
| 2017 | 193.3 | 120 | 173.9 |
| 2018 | 407.5 | 146.7 | 399.8 |
| 2019 | 204.2 | 148.9 | 192.1 |
| 2020 | 284.7 | 125.3 | 275 |
| 2021 | 698.8 | 130.3 | 630.1 |
| 2022 | 345.5 | 151.5 | 328.1 |
| 2023 | 861.5 | 140.6 | 841.1 |
| 2024 | 537.7 | 145.7 | 520.1 |
Scroll for more →
| Year | With major event days | Without major event days | Loss of supply removed |
|---|---|---|---|
| 2014 | 1.664 | 1.347 | 1.368 |
| 2015 | 1.595 | 1.334 | 1.311 |
| 2016 | 1.467 | 1.273 | 1.216 |
| 2017 | 1.336 | 1.094 | 1.148 |
| 2018 | 1.782 | 1.269 | 1.56 |
| 2019 | 1.617 | 1.389 | 1.425 |
| 2020 | 1.354 | 1.102 | 1.225 |
| 2021 | 1.527 | 1.132 | 1.322 |
| 2022 | 1.707 | 1.278 | 1.525 |
| 2023 | 1.859 | 1.129 | 1.657 |
| 2024 | 1.783 | 1.216 | 1.58 |
Scroll for more →
| Year | With major event days | Without major event days | Loss of supply removed |
|---|---|---|---|
| 2014 | 149.9 | 108.9 | 170.7 |
| 2015 | 154.1 | 105.2 | 177 |
| 2016 | 132.5 | 109.2 | 151.3 |
| 2017 | 144.7 | 109.6 | 151.5 |
| 2018 | 228.6 | 115.6 | 256.3 |
| 2019 | 126.3 | 107.1 | 134.8 |
| 2020 | 210.2 | 113.7 | 224.5 |
| 2021 | 457.7 | 115 | 476.7 |
| 2022 | 202.4 | 118.6 | 215.2 |
| 2023 | 463.4 | 124.5 | 507.5 |
| 2024 | 301.6 | 119.8 | 329.2 |
Scroll for more →
Kentucky: Any Method
| Year | With major event days | Without major event days |
|---|---|---|
| 2014 | 246.8 | 145.1 |
| 2015 | 243.9 | 139.7 |
| 2016 | 191.9 | 137.4 |
| 2017 | 194.1 | 120.1 |
| 2018 | 406.2 | 146.7 |
| 2019 | 203.3 | 148.5 |
| 2020 | 282.4 | 125.1 |
| 2021 | 707.8 | 129.8 |
| 2022 | 345.8 | 151.7 |
| 2023 | 868.2 | 143.4 |
| 2024 | 648.3 | 153.3 |
Scroll for more →
| Year | With major event days | Without major event days |
|---|---|---|
| 2014 | 1.65 | 1.342 |
| 2015 | 1.588 | 1.332 |
| 2016 | 1.457 | 1.261 |
| 2017 | 1.347 | 1.096 |
| 2018 | 1.785 | 1.27 |
| 2019 | 1.61 | 1.383 |
| 2020 | 1.351 | 1.1 |
| 2021 | 1.529 | 1.131 |
| 2022 | 1.781 | 1.3 |
| 2023 | 1.903 | 1.167 |
| 2024 | 1.955 | 1.32 |
Scroll for more →
| Year | With major event days | Without major event days |
|---|---|---|
| 2014 | 149.5 | 108.1 |
| 2015 | 153.6 | 104.9 |
| 2016 | 131.7 | 108.9 |
| 2017 | 144.2 | 109.6 |
| 2018 | 227.6 | 115.6 |
| 2019 | 126.3 | 107.4 |
| 2020 | 209 | 113.8 |
| 2021 | 462.8 | 114.8 |
| 2022 | 194.1 | 116.7 |
| 2023 | 456.3 | 122.9 |
| 2024 | 331.7 | 116.1 |
Scroll for more →
Louisiana — 2014–2024 history
Direct link to Louisiana · Choose another state
Louisiana: IEEE
| Year | With major event days | Without major event days | Loss of supply removed |
|---|---|---|---|
| 2014 | 499.1 | 156.7 | 271.9 |
| 2015 | 411.9 | 199 | 392.1 |
| 2016 | 442.6 | 190.1 | 429.8 |
| 2017 | 423.5 | 196.9 | 400.9 |
| 2018 | 285.7 | 214.2 | 260.7 |
| 2019 | 521.2 | 223.5 | 441.5 |
| 2020 | 4331.9 | 217.9 | 4204.5 |
| 2021 | 5868.8 | 265 | 5836.4 |
| 2022 | 323.8 | 252.2 | 306.6 |
| 2023 | 663.2 | 199.3 | 633.7 |
| 2024 | 630.6 | 215.9 | 603 |
Scroll for more →
| Year | With major event days | Without major event days | Loss of supply removed |
|---|---|---|---|
| 2014 | 2.987 | 1.481 | 1.596 |
| 2015 | 2.279 | 1.811 | 2.02 |
| 2016 | 2.082 | 1.745 | 1.913 |
| 2017 | 2.267 | 1.715 | 2.032 |
| 2018 | 2.032 | 1.819 | 1.849 |
| 2019 | 2.133 | 1.612 | 1.986 |
| 2020 | 3.34 | 1.625 | 3.124 |
| 2021 | 3.355 | 1.781 | 3.093 |
| 2022 | 1.992 | 1.859 | 1.855 |
| 2023 | 1.881 | 1.501 | 1.759 |
| 2024 | 2.356 | 1.661 | 2.21 |
Scroll for more →
| Year | With major event days | Without major event days | Loss of supply removed |
|---|---|---|---|
| 2014 | 167.1 | 105.8 | 170.4 |
| 2015 | 180.8 | 109.9 | 194.1 |
| 2016 | 212.5 | 108.9 | 224.7 |
| 2017 | 186.8 | 114.8 | 197.3 |
| 2018 | 140.6 | 117.8 | 141 |
| 2019 | 244.4 | 138.6 | 222.3 |
| 2020 | 1297 | 134.1 | 1345.8 |
| 2021 | 1749.4 | 148.8 | 1886.8 |
| 2022 | 162.6 | 135.7 | 165.3 |
| 2023 | 352.5 | 132.8 | 360.3 |
| 2024 | 267.7 | 130 | 272.8 |
Scroll for more →
Louisiana: Any Method
| Year | With major event days | Without major event days |
|---|---|---|
| 2014 | 310.4 | 154.1 |
| 2015 | 361.1 | 188.9 |
| 2016 | 392.9 | 185.7 |
| 2017 | 390.6 | 192.1 |
| 2018 | 276 | 206.1 |
| 2019 | 472.3 | 208.1 |
| 2020 | 3624.4 | 216.4 |
| 2021 | 4811.1 | 228.2 |
| 2022 | 304 | 246.1 |
| 2023 | 584.2 | 195 |
| 2024 | 727.5 | 206 |
Scroll for more →
| Year | With major event days | Without major event days |
|---|---|---|
| 2014 | 2.387 | 1.533 |
| 2015 | 2.266 | 1.805 |
| 2016 | 2.118 | 1.773 |
| 2017 | 2.289 | 1.727 |
| 2018 | 2.096 | 1.84 |
| 2019 | 2.166 | 1.648 |
| 2020 | 3.228 | 1.721 |
| 2021 | 3.295 | 1.848 |
| 2022 | 2.077 | 1.931 |
| 2023 | 2.124 | 1.641 |
| 2024 | 2.722 | 1.751 |
Scroll for more →
| Year | With major event days | Without major event days |
|---|---|---|
| 2014 | 130.1 | 100.5 |
| 2015 | 159.3 | 104.7 |
| 2016 | 185.5 | 104.7 |
| 2017 | 170.6 | 111.2 |
| 2018 | 131.7 | 112 |
| 2019 | 218 | 126.3 |
| 2020 | 1122.7 | 125.7 |
| 2021 | 1459.9 | 123.5 |
| 2022 | 146.4 | 127.5 |
| 2023 | 275.1 | 118.8 |
| 2024 | 267.2 | 117.6 |
Scroll for more →
Maine — 2014–2024 history
Direct link to Maine · Choose another state
Maine: IEEE
| Year | With major event days | Without major event days | Loss of supply removed |
|---|---|---|---|
| 2014 | 1049.3 | 235.3 | 1046.1 |
| 2015 | 213.6 | 198.7 | 171.3 |
| 2016 | 535.4 | 264.4 | 510.3 |
| 2017 | 2492.6 | 238.5 | 2440.6 |
| 2018 | 665.3 | 273 | 639.3 |
| 2019 | 908.1 | 213.7 | 881.8 |
| 2020 | 1725 | 244.8 | 1718.4 |
| 2021 | 325.2 | 223.5 | 312.1 |
| 2022 | 963.6 | 216.7 | 930.7 |
| 2023 | 1863 | 247.4 | 1781.4 |
| 2024 | 1748.6 | 274 | 1701 |
Scroll for more →
| Year | With major event days | Without major event days | Loss of supply removed |
|---|---|---|---|
| 2014 | 5.123 | 2.041 | 5.101 |
| 2015 | 1.871 | 1.818 | 1.677 |
| 2016 | 2.693 | 2.166 | 2.369 |
| 2017 | 2.814 | 1.93 | 2.632 |
| 2018 | 2.801 | 2.038 | 2.598 |
| 2019 | 2.525 | 1.679 | 2.292 |
| 2020 | 3.863 | 2.117 | 3.75 |
| 2021 | 2.492 | 2.072 | 2.223 |
| 2022 | 3.001 | 1.956 | 2.786 |
| 2023 | 3.314 | 1.979 | 3.015 |
| 2024 | 3.636 | 2.139 | 3.326 |
Scroll for more →
| Year | With major event days | Without major event days | Loss of supply removed |
|---|---|---|---|
| 2014 | 204.8 | 115.3 | 205.1 |
| 2015 | 114.2 | 109.3 | 102.2 |
| 2016 | 198.8 | 122 | 215.4 |
| 2017 | 885.7 | 123.6 | 927.4 |
| 2018 | 237.5 | 134 | 246.1 |
| 2019 | 359.6 | 127.3 | 384.8 |
| 2020 | 446.5 | 115.7 | 458.2 |
| 2021 | 130.5 | 107.8 | 140.4 |
| 2022 | 321.1 | 110.8 | 334.1 |
| 2023 | 562.2 | 125 | 590.9 |
| 2024 | 480.9 | 128.1 | 511.5 |
Scroll for more →
Maine: Any Method
| Year | With major event days | Without major event days |
|---|---|---|
| 2014 | 1049.3 | 235.3 |
| 2015 | 213.6 | 198.7 |
| 2016 | 535.4 | 264.4 |
| 2017 | 2492.6 | 238.5 |
| 2018 | 665.3 | 273 |
| 2019 | 908.1 | 213.7 |
| 2020 | 1725 | 244.8 |
| 2021 | 325.2 | 223.5 |
| 2022 | 963.6 | 216.7 |
| 2023 | 1863 | 247.4 |
| 2024 | 1748.6 | 274 |
Scroll for more →
| Year | With major event days | Without major event days |
|---|---|---|
| 2014 | 5.123 | 2.041 |
| 2015 | 1.871 | 1.818 |
| 2016 | 2.693 | 2.166 |
| 2017 | 2.814 | 1.93 |
| 2018 | 2.801 | 2.038 |
| 2019 | 2.525 | 1.679 |
| 2020 | 3.863 | 2.117 |
| 2021 | 2.492 | 2.072 |
| 2022 | 3.001 | 1.956 |
| 2023 | 3.314 | 1.979 |
| 2024 | 3.636 | 2.139 |
Scroll for more →
| Year | With major event days | Without major event days |
|---|---|---|
| 2014 | 204.8 | 115.3 |
| 2015 | 114.2 | 109.3 |
| 2016 | 198.8 | 122 |
| 2017 | 885.7 | 123.6 |
| 2018 | 237.5 | 134 |
| 2019 | 359.6 | 127.3 |
| 2020 | 446.5 | 115.7 |
| 2021 | 130.5 | 107.8 |
| 2022 | 321.1 | 110.8 |
| 2023 | 562.2 | 125 |
| 2024 | 480.9 | 128.1 |
Scroll for more →
Maryland — 2014–2024 history
Direct link to Maryland · Choose another state
Maryland: IEEE
| Year | With major event days | Without major event days | Loss of supply removed |
|---|---|---|---|
| 2014 | 255.9 | 93.6 | 244.4 |
| 2015 | 117.2 | 100.2 | 113.8 |
| 2016 | 120.7 | 104.5 | 115.5 |
| 2017 | 103.1 | 81.5 | 100.7 |
| 2018 | 330.4 | 93.6 | 328.4 |
| 2019 | 143.8 | 89 | 139.3 |
| 2020 | 113.8 | 76.2 | 109.2 |
| 2021 | 127.6 | 80.2 | 125.1 |
| 2022 | 260 | 84.2 | 224.6 |
| 2023 | 166.2 | 66.9 | 156.1 |
| 2024 | 118.1 | 75.1 | 116.7 |
Scroll for more →
| Year | With major event days | Without major event days | Loss of supply removed |
|---|---|---|---|
| 2014 | 1.284 | 1.01 | 1.219 |
| 2015 | 1.023 | 0.972 | 0.98 |
| 2016 | 1.099 | 1.023 | 1.055 |
| 2017 | 0.898 | 0.816 | 0.862 |
| 2018 | 1.248 | 0.939 | 1.229 |
| 2019 | 1.049 | 0.864 | 1.018 |
| 2020 | 0.919 | 0.77 | 0.882 |
| 2021 | 0.965 | 0.79 | 0.945 |
| 2022 | 1.16 | 0.84 | 1.055 |
| 2023 | 0.92 | 0.704 | 0.882 |
| 2024 | 0.817 | 0.686 | 0.802 |
Scroll for more →
| Year | With major event days | Without major event days | Loss of supply removed |
|---|---|---|---|
| 2014 | 199.3 | 92.7 | 200.5 |
| 2015 | 114.6 | 103.2 | 116.2 |
| 2016 | 109.8 | 102.2 | 109.5 |
| 2017 | 114.8 | 99.8 | 116.8 |
| 2018 | 264.8 | 99.7 | 267.1 |
| 2019 | 137.1 | 103 | 136.8 |
| 2020 | 123.8 | 98.9 | 123.8 |
| 2021 | 132.1 | 101.5 | 132.3 |
| 2022 | 224.2 | 100.2 | 213 |
| 2023 | 180.7 | 95.1 | 176.9 |
| 2024 | 144.5 | 109.6 | 145.6 |
Scroll for more →
Maryland: Any Method
| Year | With major event days | Without major event days |
|---|---|---|
| 2014 | 244.8 | 93 |
| 2015 | 124.4 | 109 |
| 2016 | 120.3 | 105.3 |
| 2017 | 116.5 | 85.6 |
| 2018 | 337.1 | 95 |
| 2019 | 141.3 | 90.6 |
| 2020 | 120.3 | 80.9 |
| 2021 | 127.1 | 80.2 |
| 2022 | 259.1 | 84.2 |
| 2023 | 166.2 | 66.9 |
| 2024 | 118.1 | 75.1 |
Scroll for more →
| Year | With major event days | Without major event days |
|---|---|---|
| 2014 | 1.265 | 1.008 |
| 2015 | 1.089 | 1.044 |
| 2016 | 1.092 | 1.022 |
| 2017 | 0.97 | 0.863 |
| 2018 | 1.296 | 0.965 |
| 2019 | 1.049 | 0.879 |
| 2020 | 0.956 | 0.805 |
| 2021 | 0.962 | 0.79 |
| 2022 | 1.156 | 0.84 |
| 2023 | 0.92 | 0.703 |
| 2024 | 0.817 | 0.686 |
Scroll for more →
| Year | With major event days | Without major event days |
|---|---|---|
| 2014 | 193.5 | 92.3 |
| 2015 | 114.2 | 104.4 |
| 2016 | 110.2 | 103.1 |
| 2017 | 120.1 | 99.1 |
| 2018 | 260.1 | 98.5 |
| 2019 | 134.7 | 103.1 |
| 2020 | 125.9 | 100.5 |
| 2021 | 132.1 | 101.5 |
| 2022 | 224.1 | 100.2 |
| 2023 | 180.7 | 95.1 |
| 2024 | 144.5 | 109.6 |
Scroll for more →
Massachusetts — 2014–2024 history
Direct link to Massachusetts · Choose another state
Massachusetts: IEEE
| Year | With major event days | Without major event days | Loss of supply removed |
|---|---|---|---|
| 2014 | 126.8 | 84.1 | 128.1 |
| 2015 | 86.4 | 71.1 | 87.6 |
| 2016 | 148.6 | 91.6 | 153.3 |
| 2017 | 178.7 | 72.7 | 186.1 |
| 2018 | 865.3 | 81.3 | 907 |
| 2019 | 244.3 | 67.5 | 256.4 |
| 2020 | 224.1 | 63.6 | 231 |
| 2021 | 527.8 | 88.1 | 600.8 |
| 2022 | 165.8 | 84.4 | 186.4 |
| 2023 | 265.3 | 83.5 | 268.5 |
| 2024 | 103.7 | 77 | 103.9 |
Scroll for more →
| Year | With major event days | Without major event days | Loss of supply removed |
|---|---|---|---|
| 2014 | 0.969 | 0.836 | 0.954 |
| 2015 | 0.781 | 0.745 | 0.782 |
| 2016 | 1.027 | 0.91 | 0.876 |
| 2017 | 1.026 | 0.254 | 0.988 |
| 2018 | 1.661 | 0.853 | 1.612 |
| 2019 | 1.115 | 0.77 | 1.089 |
| 2020 | 1.216 | 0.802 | 1.159 |
| 2021 | 1.231 | 0.889 | 1.108 |
| 2022 | 1.093 | 0.897 | 0.997 |
| 2023 | 1.069 | 0.79 | 1.025 |
| 2024 | 0.852 | 0.748 | 0.829 |
Scroll for more →
| Year | With major event days | Without major event days | Loss of supply removed |
|---|---|---|---|
| 2014 | 130.9 | 100.5 | 134.2 |
| 2015 | 110.6 | 95.4 | 112.1 |
| 2016 | 144.7 | 100.6 | 174.9 |
| 2017 | 174.2 | 286.4 | 188.3 |
| 2018 | 521.1 | 95.3 | 562.7 |
| 2019 | 219.1 | 87.7 | 235.5 |
| 2020 | 184.4 | 79.3 | 199.3 |
| 2021 | 428.8 | 99.1 | 542 |
| 2022 | 151.7 | 94 | 186.9 |
| 2023 | 248.2 | 105.7 | 262 |
| 2024 | 121.8 | 102.9 | 125.3 |
Scroll for more →
Massachusetts: Any Method
| Year | With major event days | Without major event days |
|---|---|---|
| 2014 | 124.5 | 83.2 |
| 2015 | 91.2 | 75.6 |
| 2016 | 144.9 | 113.1 |
| 2017 | 275.5 | 92.2 |
| 2018 | 813.3 | 99 |
| 2019 | 250.2 | 96.1 |
| 2020 | 318.9 | 168.1 |
| 2021 | 518.7 | 87.2 |
| 2022 | 163.2 | 83 |
| 2023 | 259.4 | 82.2 |
| 2024 | 102 | 76.1 |
Scroll for more →
| Year | With major event days | Without major event days |
|---|---|---|
| 2014 | 0.956 | 0.83 |
| 2015 | 0.787 | 0.746 |
| 2016 | 0.991 | 0.923 |
| 2017 | 1.087 | 0.577 |
| 2018 | 1.552 | 0.918 |
| 2019 | 1.224 | 0.842 |
| 2020 | 1.302 | 1.01 |
| 2021 | 1.217 | 0.88 |
| 2022 | 1.08 | 0.885 |
| 2023 | 1.057 | 0.78 |
| 2024 | 0.843 | 0.743 |
Scroll for more →
| Year | With major event days | Without major event days |
|---|---|---|
| 2014 | 130.2 | 100.3 |
| 2015 | 115.8 | 101.3 |
| 2016 | 146.3 | 122.5 |
| 2017 | 253.4 | 159.8 |
| 2018 | 524.1 | 107.8 |
| 2019 | 204.4 | 114.1 |
| 2020 | 244.9 | 166.5 |
| 2021 | 426.3 | 99 |
| 2022 | 151 | 93.8 |
| 2023 | 245.4 | 105.4 |
| 2024 | 120.9 | 102.3 |
Scroll for more →
Michigan — 2014–2024 history
Direct link to Michigan · Choose another state
Michigan: IEEE
| Year | With major event days | Without major event days | Loss of supply removed |
|---|---|---|---|
| 2014 | 592.5 | 183.3 | 589 |
| 2015 | 374.5 | 183.4 | 363.7 |
| 2016 | 268.4 | 194.2 | 262.6 |
| 2017 | 802.2 | 180.1 | 798.2 |
| 2018 | 450.2 | 186.4 | 448 |
| 2019 | 570.2 | 213.9 | 565.5 |
| 2020 | 416.7 | 168.3 | 414.3 |
| 2021 | 890.9 | 178.6 | 882.1 |
| 2022 | 520.7 | 166.8 | 519.9 |
| 2023 | 1127.7 | 164.8 | 1131.2 |
| 2024 | 481.7 | 161.3 | 456.2 |
Scroll for more →
| Year | With major event days | Without major event days | Loss of supply removed |
|---|---|---|---|
| 2014 | 1.23 | 0.898 | 1.199 |
| 2015 | 1.151 | 0.979 | 1.119 |
| 2016 | 1.13 | 1.004 | 1.105 |
| 2017 | 1.413 | 0.984 | 1.388 |
| 2018 | 1.374 | 1.054 | 1.346 |
| 2019 | 1.542 | 1.162 | 1.505 |
| 2020 | 1.375 | 1.069 | 1.339 |
| 2021 | 1.647 | 1.017 | 1.615 |
| 2022 | 1.34 | 1.016 | 1.326 |
| 2023 | 1.543 | 0.931 | 1.533 |
| 2024 | 1.365 | 0.983 | 1.252 |
Scroll for more →
| Year | With major event days | Without major event days | Loss of supply removed |
|---|---|---|---|
| 2014 | 481.9 | 204.2 | 491.4 |
| 2015 | 325.4 | 187.3 | 324.9 |
| 2016 | 237.5 | 193.5 | 237.7 |
| 2017 | 567.8 | 183 | 574.9 |
| 2018 | 327.6 | 176.8 | 332.7 |
| 2019 | 369.7 | 184.1 | 375.8 |
| 2020 | 303.1 | 157.5 | 309.5 |
| 2021 | 540.8 | 175.6 | 546.2 |
| 2022 | 388.7 | 164.2 | 391.9 |
| 2023 | 730.9 | 177.1 | 738 |
| 2024 | 353 | 164 | 364.5 |
Scroll for more →
Michigan: Any Method
| Year | With major event days | Without major event days |
|---|---|---|
| 2014 | 574.7 | 180 |
| 2015 | 363.4 | 178.8 |
| 2016 | 267.8 | 193.1 |
| 2017 | 778.8 | 179.4 |
| 2018 | 442.9 | 185 |
| 2019 | 554.9 | 211.1 |
| 2020 | 410.7 | 167.2 |
| 2021 | 873.3 | 178.4 |
| 2022 | 513.1 | 166 |
| 2023 | 1093.6 | 162.7 |
| 2024 | 470.4 | 160.1 |
Scroll for more →
| Year | With major event days | Without major event days |
|---|---|---|
| 2014 | 1.213 | 0.893 |
| 2015 | 1.141 | 0.967 |
| 2016 | 1.146 | 1.012 |
| 2017 | 1.414 | 0.989 |
| 2018 | 1.373 | 1.055 |
| 2019 | 1.535 | 1.162 |
| 2020 | 1.384 | 1.082 |
| 2021 | 1.656 | 1.033 |
| 2022 | 1.339 | 1.015 |
| 2023 | 1.512 | 0.921 |
| 2024 | 1.356 | 0.986 |
Scroll for more →
| Year | With major event days | Without major event days |
|---|---|---|
| 2014 | 473.8 | 201.5 |
| 2015 | 318.5 | 184.8 |
| 2016 | 233.6 | 190.8 |
| 2017 | 550.9 | 181.5 |
| 2018 | 322.6 | 175.4 |
| 2019 | 361.5 | 181.7 |
| 2020 | 296.8 | 154.6 |
| 2021 | 527.5 | 172.6 |
| 2022 | 383.2 | 163.6 |
| 2023 | 723.5 | 176.7 |
| 2024 | 346.8 | 162.4 |
Scroll for more →
Minnesota — 2014–2024 history
Direct link to Minnesota · Choose another state
Minnesota: IEEE
| Year | With major event days | Without major event days | Loss of supply removed |
|---|---|---|---|
| 2014 | 123.1 | 77.1 | 118.8 |
| 2015 | 160.8 | 79.4 | 159.9 |
| 2016 | 308.9 | 88.6 | 302.6 |
| 2017 | 129.8 | 71.7 | 129.1 |
| 2018 | 128.1 | 87.8 | 120.2 |
| 2019 | 148.9 | 79.9 | 137.6 |
| 2020 | 128 | 84.7 | 124.4 |
| 2021 | 121 | 81.7 | 115.7 |
| 2022 | 275.2 | 81 | 270.3 |
| 2023 | 127.1 | 72.8 | 123.6 |
| 2024 | 222.4 | 91.5 | 222.3 |
Scroll for more →
| Year | With major event days | Without major event days | Loss of supply removed |
|---|---|---|---|
| 2014 | 1.016 | 0.924 | 0.957 |
| 2015 | 0.972 | 0.828 | 0.903 |
| 2016 | 1.217 | 0.861 | 1.096 |
| 2017 | 0.953 | 0.77 | 0.877 |
| 2018 | 1.032 | 0.889 | 0.907 |
| 2019 | 0.987 | 0.793 | 0.878 |
| 2020 | 1.037 | 0.895 | 0.962 |
| 2021 | 1.039 | 0.867 | 0.94 |
| 2022 | 1.207 | 0.846 | 1.101 |
| 2023 | 0.973 | 0.778 | 0.859 |
| 2024 | 1.262 | 0.902 | 1.144 |
Scroll for more →
| Year | With major event days | Without major event days | Loss of supply removed |
|---|---|---|---|
| 2014 | 121.1 | 83.5 | 124.2 |
| 2015 | 165.4 | 95.9 | 177.1 |
| 2016 | 253.7 | 102.9 | 276.2 |
| 2017 | 136.2 | 93.1 | 147.2 |
| 2018 | 124.1 | 98.8 | 132.5 |
| 2019 | 150.9 | 100.7 | 156.6 |
| 2020 | 123.5 | 94.6 | 129.2 |
| 2021 | 116.5 | 94.2 | 123.1 |
| 2022 | 228 | 95.8 | 245.5 |
| 2023 | 130.6 | 93.6 | 143.9 |
| 2024 | 176.3 | 101.5 | 194.3 |
Scroll for more →
Minnesota: Any Method
| Year | With major event days | Without major event days |
|---|---|---|
| 2014 | 119.4 | 76.4 |
| 2015 | 154.5 | 77.8 |
| 2016 | 301.2 | 87.7 |
| 2017 | 129.7 | 73.5 |
| 2018 | 127.4 | 87.6 |
| 2019 | 150.1 | 81.2 |
| 2020 | 127.6 | 85.6 |
| 2021 | 120.9 | 82.5 |
| 2022 | 273.7 | 82.2 |
| 2023 | 126.4 | 73.4 |
| 2024 | 219.6 | 92.2 |
Scroll for more →
| Year | With major event days | Without major event days |
|---|---|---|
| 2014 | 0.995 | 0.901 |
| 2015 | 0.969 | 0.813 |
| 2016 | 1.193 | 0.855 |
| 2017 | 0.946 | 0.775 |
| 2018 | 1.016 | 0.885 |
| 2019 | 0.994 | 0.805 |
| 2020 | 1.036 | 0.901 |
| 2021 | 1.041 | 0.876 |
| 2022 | 1.21 | 0.856 |
| 2023 | 0.973 | 0.785 |
| 2024 | 1.25 | 0.901 |
Scroll for more →
| Year | With major event days | Without major event days |
|---|---|---|
| 2014 | 120.1 | 84.8 |
| 2015 | 159.4 | 95.7 |
| 2016 | 252.4 | 102.6 |
| 2017 | 137.1 | 94.8 |
| 2018 | 125.4 | 98.9 |
| 2019 | 151 | 100.9 |
| 2020 | 123.1 | 95 |
| 2021 | 116.2 | 94.2 |
| 2022 | 226.3 | 96 |
| 2023 | 129.9 | 93.5 |
| 2024 | 175.6 | 102.3 |
Scroll for more →
Mississippi — 2014–2024 history
Direct link to Mississippi · Choose another state
Mississippi: IEEE
| Year | With major event days | Without major event days | Loss of supply removed |
|---|---|---|---|
| 2014 | 279.4 | 180 | 278.6 |
| 2015 | 363.3 | 227.7 | 316.9 |
| 2016 | 276.3 | 179.9 | 302.7 |
| 2017 | 580.2 | 205.5 | 588 |
| 2018 | 271.6 | 209.7 | 310.2 |
| 2019 | 466.1 | 214.3 | 537.3 |
| 2020 | 1611.7 | 203.9 | 1558.2 |
| 2021 | 1189.8 | 224.5 | 1419.2 |
| 2022 | 455.9 | 243.3 | 519.9 |
| 2023 | 877.8 | 266.6 | 991.9 |
| 2024 | 607.3 | 279 | 693.8 |
Scroll for more →
| Year | With major event days | Without major event days | Loss of supply removed |
|---|---|---|---|
| 2014 | 2.042 | 1.371 | 1.761 |
| 2015 | 2.148 | 1.809 | 1.928 |
| 2016 | 1.861 | 1.634 | 1.918 |
| 2017 | 2.121 | 1.486 | 2.319 |
| 2018 | 1.733 | 1.604 | 1.87 |
| 2019 | 2.012 | 1.587 | 2.154 |
| 2020 | 2.379 | 1.407 | 2.374 |
| 2021 | 2.29 | 1.494 | 2.468 |
| 2022 | 2.168 | 1.729 | 2.254 |
| 2023 | 2.627 | 2.113 | 2.932 |
| 2024 | 2.482 | 1.882 | 2.714 |
Scroll for more →
| Year | With major event days | Without major event days | Loss of supply removed |
|---|---|---|---|
| 2014 | 136.8 | 131.3 | 158.2 |
| 2015 | 169.1 | 125.8 | 164.4 |
| 2016 | 148.4 | 110.1 | 157.9 |
| 2017 | 273.5 | 138.3 | 253.5 |
| 2018 | 156.7 | 130.8 | 165.9 |
| 2019 | 231.7 | 135 | 249.4 |
| 2020 | 677.5 | 144.9 | 656.3 |
| 2021 | 519.6 | 150.3 | 575.1 |
| 2022 | 210.2 | 140.7 | 230.7 |
| 2023 | 334.1 | 126.2 | 338.3 |
| 2024 | 244.7 | 148.3 | 255.7 |
Scroll for more →
Mississippi: Any Method
| Year | With major event days | Without major event days |
|---|---|---|
| 2014 | 226 | 155.7 |
| 2015 | 310.4 | 197.5 |
| 2016 | 277.4 | 187.3 |
| 2017 | 566.8 | 211.3 |
| 2018 | 267.5 | 211.9 |
| 2019 | 536.5 | 220 |
| 2020 | 1496.7 | 211.3 |
| 2021 | 1134.4 | 220.6 |
| 2022 | 448.5 | 246.7 |
| 2023 | 802.1 | 252.8 |
| 2024 | 567.1 | 266.3 |
Scroll for more →
| Year | With major event days | Without major event days |
|---|---|---|
| 2014 | 1.714 | 1.238 |
| 2015 | 1.969 | 1.579 |
| 2016 | 1.927 | 1.712 |
| 2017 | 2.196 | 1.571 |
| 2018 | 1.762 | 1.633 |
| 2019 | 2.096 | 1.607 |
| 2020 | 2.513 | 1.487 |
| 2021 | 2.367 | 1.556 |
| 2022 | 2.429 | 1.967 |
| 2023 | 2.717 | 2.142 |
| 2024 | 2.555 | 1.963 |
Scroll for more →
| Year | With major event days | Without major event days |
|---|---|---|
| 2014 | 131.9 | 125.7 |
| 2015 | 157.6 | 125.1 |
| 2016 | 143.9 | 109.4 |
| 2017 | 258.2 | 134.5 |
| 2018 | 151.8 | 129.8 |
| 2019 | 255.9 | 136.9 |
| 2020 | 595.7 | 142.1 |
| 2021 | 479.3 | 141.8 |
| 2022 | 184.6 | 125.4 |
| 2023 | 295.2 | 118 |
| 2024 | 221.9 | 135.6 |
Scroll for more →
Missouri — 2014–2024 history
Direct link to Missouri · Choose another state
Missouri: IEEE
| Year | With major event days | Without major event days | Loss of supply removed |
|---|---|---|---|
| 2014 | 134.3 | 101.2 | 139.8 |
| 2015 | 164.9 | 98.3 | 249.2 |
| 2016 | 215.4 | 86.6 | 149.8 |
| 2017 | 307.2 | 90.8 | 445.9 |
| 2018 | 151.2 | 91.8 | 174.1 |
| 2019 | 261 | 113.6 | 372.9 |
| 2020 | 154.1 | 96.7 | 159.8 |
| 2021 | 267.9 | 97.8 | 265.6 |
| 2022 | 149.5 | 97 | 144.2 |
| 2023 | 379 | 104.4 | 391.2 |
| 2024 | 212.6 | 106.6 | 206 |
Scroll for more →
| Year | With major event days | Without major event days | Loss of supply removed |
|---|---|---|---|
| 2014 | 1.079 | 0.968 | 1.08 |
| 2015 | 1.023 | 0.932 | 1.276 |
| 2016 | 1.042 | 0.776 | 0.963 |
| 2017 | 1.16 | 0.782 | 1.303 |
| 2018 | 0.974 | 0.831 | 1.108 |
| 2019 | 1.301 | 1.019 | 1.557 |
| 2020 | 1.002 | 0.862 | 0.969 |
| 2021 | 1.265 | 0.834 | 1.147 |
| 2022 | 1.057 | 0.879 | 0.985 |
| 2023 | 1.324 | 0.878 | 1.263 |
| 2024 | 1.176 | 0.924 | 1.07 |
Scroll for more →
| Year | With major event days | Without major event days | Loss of supply removed |
|---|---|---|---|
| 2014 | 124.5 | 104.6 | 129.4 |
| 2015 | 161.3 | 105.5 | 195.3 |
| 2016 | 206.8 | 111.6 | 155.6 |
| 2017 | 264.7 | 116 | 342.3 |
| 2018 | 155.3 | 110.5 | 157.2 |
| 2019 | 200.6 | 111.5 | 239.5 |
| 2020 | 153.8 | 112.1 | 164.9 |
| 2021 | 211.8 | 117.2 | 231.6 |
| 2022 | 141.5 | 110.3 | 146.3 |
| 2023 | 286.1 | 118.9 | 309.8 |
| 2024 | 180.8 | 115.4 | 192.5 |
Scroll for more →
Missouri: Any Method
| Year | With major event days | Without major event days |
|---|---|---|
| 2014 | 136.7 | 101 |
| 2015 | 171.1 | 98.2 |
| 2016 | 205.7 | 86.7 |
| 2017 | 305.8 | 93.3 |
| 2018 | 149.6 | 94.6 |
| 2019 | 255.2 | 112.8 |
| 2020 | 152.6 | 95.1 |
| 2021 | 259.7 | 97.3 |
| 2022 | 148 | 97 |
| 2023 | 371.8 | 106.7 |
| 2024 | 224.3 | 106 |
Scroll for more →
| Year | With major event days | Without major event days |
|---|---|---|
| 2014 | 1.078 | 0.975 |
| 2015 | 1.058 | 0.951 |
| 2016 | 1.05 | 0.799 |
| 2017 | 1.201 | 0.823 |
| 2018 | 0.973 | 0.841 |
| 2019 | 1.297 | 1.018 |
| 2020 | 0.997 | 0.851 |
| 2021 | 1.244 | 0.828 |
| 2022 | 1.05 | 0.876 |
| 2023 | 1.315 | 0.876 |
| 2024 | 1.189 | 0.919 |
Scroll for more →
| Year | With major event days | Without major event days |
|---|---|---|
| 2014 | 126.7 | 103.6 |
| 2015 | 161.7 | 103.3 |
| 2016 | 195.9 | 108.5 |
| 2017 | 254.6 | 113.4 |
| 2018 | 153.8 | 112.5 |
| 2019 | 196.8 | 110.9 |
| 2020 | 153.1 | 111.6 |
| 2021 | 208.8 | 117.5 |
| 2022 | 141 | 110.7 |
| 2023 | 282.9 | 121.7 |
| 2024 | 188.6 | 115.3 |
Scroll for more →
Montana — 2014–2024 history
Direct link to Montana · Choose another state
Montana: IEEE
| Year | With major event days | Without major event days | Loss of supply removed |
|---|---|---|---|
| 2014 | 144.9 | 123.8 | 137.3 |
| 2015 | 295.4 | 143.5 | 284.7 |
| 2016 | 155.7 | 128.8 | 110.7 |
| 2017 | 218.9 | 160.8 | 209.1 |
| 2018 | 135.4 | 118.3 | 107.4 |
| 2019 | 165.8 | 121.7 | 138.9 |
| 2020 | 275.3 | 136 | 240.7 |
| 2021 | 251.7 | 142.6 | 211.2 |
| 2022 | 224.7 | 139.6 | 187.7 |
| 2023 | 113.9 | 113.9 | 93.9 |
| 2024 | 341.7 | 152.3 | 298.1 |
Scroll for more →
| Year | With major event days | Without major event days | Loss of supply removed |
|---|---|---|---|
| 2014 | 1.188 | 1.128 | 1.104 |
| 2015 | 1.694 | 1.446 | 1.574 |
| 2016 | 1.259 | 1.136 | 0.944 |
| 2017 | 1.551 | 1.361 | 1.528 |
| 2018 | 1.192 | 1.182 | 0.802 |
| 2019 | 1.345 | 1.237 | 1.022 |
| 2020 | 1.343 | 1.055 | 1.143 |
| 2021 | 1.621 | 1.348 | 1.133 |
| 2022 | 1.398 | 1.214 | 1.059 |
| 2023 | 1.052 | 1.052 | 0.852 |
| 2024 | 1.628 | 1.163 | 1.36 |
Scroll for more →
| Year | With major event days | Without major event days | Loss of supply removed |
|---|---|---|---|
| 2014 | 122 | 109.8 | 124.3 |
| 2015 | 174.4 | 99.2 | 180.9 |
| 2016 | 123.6 | 113.4 | 117.3 |
| 2017 | 141.1 | 118.1 | 136.8 |
| 2018 | 113.5 | 100.1 | 134 |
| 2019 | 123.3 | 98.4 | 135.9 |
| 2020 | 204.9 | 129 | 210.6 |
| 2021 | 155.3 | 105.8 | 186.4 |
| 2022 | 160.7 | 115 | 177.2 |
| 2023 | 108.3 | 108.3 | 110.2 |
| 2024 | 209.8 | 130.9 | 219.2 |
Scroll for more →
Montana: Any Method
| Year | With major event days | Without major event days |
|---|---|---|
| 2014 | 138.8 | 123.5 |
| 2015 | 287.9 | 142.3 |
| 2016 | 160.7 | 129.9 |
| 2017 | 215.4 | 161.4 |
| 2018 | 142.7 | 118 |
| 2019 | 169.3 | 127 |
| 2020 | 271.3 | 140.9 |
| 2021 | 309.9 | 146 |
| 2022 | 225.6 | 146.1 |
| 2023 | 118.7 | 117.1 |
| 2024 | 351.5 | 156.6 |
Scroll for more →
| Year | With major event days | Without major event days |
|---|---|---|
| 2014 | 1.134 | 1.128 |
| 2015 | 1.752 | 1.446 |
| 2016 | 1.262 | 1.136 |
| 2017 | 1.575 | 1.361 |
| 2018 | 1.278 | 1.183 |
| 2019 | 1.327 | 1.243 |
| 2020 | 1.364 | 1.057 |
| 2021 | 1.706 | 1.341 |
| 2022 | 1.376 | 1.203 |
| 2023 | 1.068 | 1.055 |
| 2024 | 1.621 | 1.161 |
Scroll for more →
| Year | With major event days | Without major event days |
|---|---|---|
| 2014 | 122.4 | 109.6 |
| 2015 | 164.3 | 98.4 |
| 2016 | 127.4 | 114.4 |
| 2017 | 136.8 | 118.6 |
| 2018 | 111.7 | 99.7 |
| 2019 | 127.6 | 102.2 |
| 2020 | 199 | 133.4 |
| 2021 | 181.7 | 108.9 |
| 2022 | 163.9 | 121.5 |
| 2023 | 111.1 | 111 |
| 2024 | 216.9 | 134.9 |
Scroll for more →
Nebraska — 2014–2024 history
Direct link to Nebraska · Choose another state
Nebraska: IEEE
| Year | With major event days | Without major event days | Loss of supply removed |
|---|---|---|---|
| 2014 | 98.3 | 50.7 | 86.3 |
| 2015 | 67.9 | 50.2 | 49 |
| 2016 | 63.1 | 49.2 | 52.2 |
| 2017 | 160.7 | 72.5 | 110.4 |
| 2018 | 185.7 | 76.8 | 96.1 |
| 2019 | 78.9 | 59.2 | 54.9 |
| 2020 | 115.4 | 67.4 | 96.1 |
| 2021 | 556.9 | 59.9 | 555.3 |
| 2022 | 73 | 56.2 | 71.1 |
| 2023 | 69.4 | 55.6 | 66.4 |
| 2024 | 697.8 | 69.8 | 696.7 |
Scroll for more →
| Year | With major event days | Without major event days | Loss of supply removed |
|---|---|---|---|
| 2014 | 0.69 | 0.603 | 0.569 |
| 2015 | 0.662 | 0.572 | 0.523 |
| 2016 | 0.702 | 0.578 | 0.648 |
| 2017 | 0.909 | 0.677 | 0.672 |
| 2018 | 1.099 | 0.73 | 0.651 |
| 2019 | 0.659 | 0.549 | 0.655 |
| 2020 | 0.792 | 0.552 | 0.917 |
| 2021 | 1.165 | 0.516 | 1.144 |
| 2022 | 0.59 | 0.534 | 0.573 |
| 2023 | 0.555 | 0.478 | 0.545 |
| 2024 | 1.244 | 0.6 | 1.235 |
Scroll for more →
| Year | With major event days | Without major event days | Loss of supply removed |
|---|---|---|---|
| 2014 | 142.4 | 83.9 | 151.6 |
| 2015 | 102.6 | 87.8 | 93.6 |
| 2016 | 89.9 | 85.1 | 80.5 |
| 2017 | 176.9 | 107.1 | 164.2 |
| 2018 | 168.9 | 105.2 | 147.6 |
| 2019 | 119.7 | 107.7 | 83.8 |
| 2020 | 145.7 | 122.1 | 104.9 |
| 2021 | 477.9 | 116.1 | 485.6 |
| 2022 | 123.8 | 105.2 | 124 |
| 2023 | 125.2 | 116.2 | 121.8 |
| 2024 | 560.8 | 116.3 | 564 |
Scroll for more →
Nebraska: Any Method
| Year | With major event days | Without major event days |
|---|---|---|
| 2014 | 123 | 66.7 |
| 2015 | 86.2 | 51.9 |
| 2016 | 83.6 | 52 |
| 2017 | 154.3 | 69.9 |
| 2018 | 188.2 | 74.2 |
| 2019 | 84 | 62.4 |
| 2020 | 113.4 | 68.8 |
| 2021 | 516 | 60.8 |
| 2022 | 82.1 | 62.3 |
| 2023 | 72.6 | 56.8 |
| 2024 | 641.7 | 73.6 |
Scroll for more →
| Year | With major event days | Without major event days |
|---|---|---|
| 2014 | 0.869 | 0.699 |
| 2015 | 0.732 | 0.553 |
| 2016 | 0.675 | 0.556 |
| 2017 | 0.879 | 0.676 |
| 2018 | 1.085 | 0.707 |
| 2019 | 0.654 | 0.547 |
| 2020 | 0.79 | 0.556 |
| 2021 | 1.154 | 0.511 |
| 2022 | 0.608 | 0.541 |
| 2023 | 0.558 | 0.48 |
| 2024 | 1.232 | 0.595 |
Scroll for more →
| Year | With major event days | Without major event days |
|---|---|---|
| 2014 | 141.5 | 95.5 |
| 2015 | 117.8 | 93.8 |
| 2016 | 124 | 93.6 |
| 2017 | 175.6 | 103.4 |
| 2018 | 173.4 | 105 |
| 2019 | 128.4 | 114.1 |
| 2020 | 143.6 | 123.8 |
| 2021 | 447 | 119 |
| 2022 | 134.9 | 115.1 |
| 2023 | 130.1 | 118.3 |
| 2024 | 520.8 | 123.8 |
Scroll for more →
Nevada — 2014–2024 history
Direct link to Nevada · Choose another state
Nevada: IEEE
| Year | With major event days | Without major event days | Loss of supply removed |
|---|---|---|---|
| 2014 | 75.7 | 62.6 | UNKNOWN |
| 2015 | 107 | 55.4 | 153.8 |
| 2016 | 95.7 | 73.7 | 457 |
| 2017 | 114.4 | 87.7 | 82.8 |
| 2018 | 126.2 | 76.7 | 93.3 |
| 2019 | 87 | 77.5 | 92 |
| 2020 | 73.3 | 55.3 | 54.4 |
| 2021 | 102.4 | 69.6 | 6.8 |
| 2022 | 195.1 | 77 | 424.3 |
| 2023 | 138.7 | 81.2 | 96.9 |
| 2024 | 158.9 | 63.8 | 116.7 |
Scroll for more →
| Year | With major event days | Without major event days | Loss of supply removed |
|---|---|---|---|
| 2014 | 0.702 | 0.632 | UNKNOWN |
| 2015 | 0.731 | 0.557 | 1.751 |
| 2016 | 0.835 | 0.735 | 1.36 |
| 2017 | 0.905 | 0.811 | 1.033 |
| 2018 | 0.976 | 0.813 | 1.443 |
| 2019 | 0.815 | 0.773 | 0.88 |
| 2020 | 0.722 | 0.582 | 0.558 |
| 2021 | 0.837 | 0.669 | 0.061 |
| 2022 | 0.984 | 0.722 | 1.953 |
| 2023 | 0.942 | 0.745 | 1.131 |
| 2024 | 1.108 | 0.658 | 1.313 |
Scroll for more →
| Year | With major event days | Without major event days | Loss of supply removed |
|---|---|---|---|
| 2014 | 107.8 | 99.1 | UNKNOWN |
| 2015 | 146.3 | 99.4 | 87.9 |
| 2016 | 114.6 | 100.4 | 336 |
| 2017 | 126.5 | 108.2 | 80.1 |
| 2018 | 129.2 | 94.3 | 64.6 |
| 2019 | 106.8 | 100.3 | 104.6 |
| 2020 | 101.6 | 95.1 | 97.5 |
| 2021 | 122.3 | 104.1 | 111 |
| 2022 | 198.2 | 106.7 | 217.2 |
| 2023 | 147.2 | 108.9 | 85.7 |
| 2024 | 143.4 | 97 | 88.9 |
Scroll for more →
Nevada: Any Method
| Year | With major event days | Without major event days |
|---|---|---|
| 2014 | 75.7 | 62.6 |
| 2015 | 107 | 55.4 |
| 2016 | 95.7 | 73.7 |
| 2017 | 114.4 | 87.7 |
| 2018 | 126.2 | 76.7 |
| 2019 | 87 | 77.5 |
| 2020 | 73.3 | 55.3 |
| 2021 | 102.4 | 69.6 |
| 2022 | 195.1 | 77 |
| 2023 | 138.7 | 81.2 |
| 2024 | 158.9 | 63.8 |
Scroll for more →
| Year | With major event days | Without major event days |
|---|---|---|
| 2014 | 0.702 | 0.632 |
| 2015 | 0.731 | 0.557 |
| 2016 | 0.835 | 0.735 |
| 2017 | 0.905 | 0.811 |
| 2018 | 0.976 | 0.813 |
| 2019 | 0.815 | 0.773 |
| 2020 | 0.722 | 0.582 |
| 2021 | 0.837 | 0.669 |
| 2022 | 0.984 | 0.722 |
| 2023 | 0.942 | 0.745 |
| 2024 | 1.108 | 0.658 |
Scroll for more →
| Year | With major event days | Without major event days |
|---|---|---|
| 2014 | 107.8 | 99.1 |
| 2015 | 146.3 | 99.4 |
| 2016 | 114.6 | 100.4 |
| 2017 | 126.5 | 108.2 |
| 2018 | 129.2 | 94.3 |
| 2019 | 106.8 | 100.3 |
| 2020 | 101.6 | 95.1 |
| 2021 | 122.3 | 104.1 |
| 2022 | 198.2 | 106.7 |
| 2023 | 147.2 | 108.9 |
| 2024 | 143.4 | 97 |
Scroll for more →
New Hampshire — 2014–2024 history
Direct link to New Hampshire · Choose another state
New Hampshire: IEEE
| Year | With major event days | Without major event days | Loss of supply removed |
|---|---|---|---|
| 2014 | 815.3 | 136.6 | 821.9 |
| 2015 | 117.3 | 104.8 | 117 |
| 2016 | 192.5 | 135.3 | 190.9 |
| 2017 | 915.4 | 120.5 | 915 |
| 2018 | 450.8 | 122 | 449.7 |
| 2019 | 219.6 | 84.9 | 219.6 |
| 2020 | 408.5 | 99 | 407.9 |
| 2021 | 176.5 | 98.3 | 165 |
| 2022 | 495.5 | 78.2 | 487.4 |
| 2023 | 590.6 | 89.3 | 587.7 |
| 2024 | 735.5 | 84.2 | 733 |
Scroll for more →
| Year | With major event days | Without major event days | Loss of supply removed |
|---|---|---|---|
| 2014 | 1.969 | 1.363 | 1.816 |
| 2015 | 1.13 | 1.095 | 1.054 |
| 2016 | 1.534 | 1.36 | 1.49 |
| 2017 | 2.004 | 1.146 | 1.982 |
| 2018 | 1.889 | 1.082 | 1.871 |
| 2019 | 1.168 | 0.765 | 1.168 |
| 2020 | 1.514 | 0.913 | 1.504 |
| 2021 | 1.095 | 0.858 | 0.954 |
| 2022 | 1.417 | 0.7 | 1.383 |
| 2023 | 1.485 | 0.766 | 1.48 |
| 2024 | 1.616 | 0.775 | 1.597 |
Scroll for more →
| Year | With major event days | Without major event days | Loss of supply removed |
|---|---|---|---|
| 2014 | 414.2 | 100.2 | 452.6 |
| 2015 | 103.9 | 95.7 | 111.1 |
| 2016 | 125.5 | 99.5 | 128.1 |
| 2017 | 456.7 | 105.1 | 461.7 |
| 2018 | 238.6 | 112.8 | 240.4 |
| 2019 | 188 | 110.9 | 188 |
| 2020 | 269.7 | 108.4 | 271.2 |
| 2021 | 161.2 | 114.5 | 173.1 |
| 2022 | 349.6 | 111.8 | 352.5 |
| 2023 | 397.7 | 116.6 | 397.2 |
| 2024 | 455.2 | 108.5 | 459 |
Scroll for more →
New Hampshire: Any Method
| Year | With major event days | Without major event days |
|---|---|---|
| 2014 | 862.9 | 172.5 |
| 2015 | 149.3 | 138.2 |
| 2016 | 192 | 141.1 |
| 2017 | 1113.3 | 151.1 |
| 2018 | 508.8 | 151.7 |
| 2019 | 292 | 111 |
| 2020 | 499.4 | 121.8 |
| 2021 | 234.4 | 127.1 |
| 2022 | 616.7 | 107.5 |
| 2023 | 645.8 | 124.6 |
| 2024 | 922.7 | 132.3 |
Scroll for more →
| Year | With major event days | Without major event days |
|---|---|---|
| 2014 | 2.264 | 1.582 |
| 2015 | 1.384 | 1.353 |
| 2016 | 1.537 | 1.382 |
| 2017 | 2.297 | 1.295 |
| 2018 | 2.173 | 1.268 |
| 2019 | 1.429 | 0.919 |
| 2020 | 1.821 | 1.085 |
| 2021 | 1.368 | 1.078 |
| 2022 | 1.783 | 0.931 |
| 2023 | 1.753 | 0.989 |
| 2024 | 2.021 | 0.985 |
Scroll for more →
| Year | With major event days | Without major event days |
|---|---|---|
| 2014 | 381.1 | 109.1 |
| 2015 | 107.9 | 102.1 |
| 2016 | 124.9 | 102.1 |
| 2017 | 484.7 | 116.7 |
| 2018 | 234.2 | 119.7 |
| 2019 | 204.3 | 120.8 |
| 2020 | 274.3 | 112.3 |
| 2021 | 171.3 | 117.9 |
| 2022 | 345.9 | 115.6 |
| 2023 | 368.5 | 126.1 |
| 2024 | 456.6 | 134.3 |
Scroll for more →
New Jersey — 2014–2024 history
Direct link to New Jersey · Choose another state
New Jersey: IEEE
| Year | With major event days | Without major event days | Loss of supply removed |
|---|---|---|---|
| 2014 | 111.7 | 78.3 | 109.1 |
| 2015 | 263.6 | 64 | 259 |
| 2016 | 137.5 | 85 | 115.7 |
| 2017 | 85.5 | 71 | 80.4 |
| 2018 | 505.5 | 87.4 | 491.6 |
| 2019 | 249.7 | 86.4 | 240.2 |
| 2020 | 943.3 | 86.5 | 911.3 |
| 2021 | 139.2 | 84.3 | 127.1 |
| 2022 | 89.6 | 78.7 | 81.4 |
| 2023 | 108.2 | 88 | 99.2 |
| 2024 | 173.3 | 98.8 | 161.2 |
Scroll for more →
| Year | With major event days | Without major event days | Loss of supply removed |
|---|---|---|---|
| 2014 | 0.953 | 0.867 | 0.914 |
| 2015 | 0.994 | 0.833 | 0.953 |
| 2016 | 1.158 | 0.981 | 1.083 |
| 2017 | 0.936 | 0.876 | 0.881 |
| 2018 | 1.415 | 0.962 | 1.287 |
| 2019 | 1.193 | 0.942 | 1.081 |
| 2020 | 1.581 | 0.939 | 1.438 |
| 2021 | 1.002 | 0.886 | 0.868 |
| 2022 | 0.876 | 0.838 | 0.776 |
| 2023 | 0.88 | 0.83 | 0.783 |
| 2024 | 1.116 | 0.944 | 0.971 |
Scroll for more →
| Year | With major event days | Without major event days | Loss of supply removed |
|---|---|---|---|
| 2014 | 117.2 | 90.3 | 119.4 |
| 2015 | 265.1 | 76.8 | 271.7 |
| 2016 | 118.7 | 86.6 | 106.9 |
| 2017 | 91.3 | 81 | 91.3 |
| 2018 | 357.2 | 90.9 | 382.1 |
| 2019 | 209.2 | 91.7 | 222.2 |
| 2020 | 596.4 | 92.1 | 633.9 |
| 2021 | 139 | 95.2 | 146.4 |
| 2022 | 102.3 | 94 | 104.9 |
| 2023 | 122.9 | 106 | 126.8 |
| 2024 | 155.3 | 104.7 | 166 |
Scroll for more →
New Jersey: Any Method
| Year | With major event days | Without major event days |
|---|---|---|
| 2014 | 112 | 78.7 |
| 2015 | 260.6 | 64.6 |
| 2016 | 137.2 | 85.7 |
| 2017 | 85.8 | 71.4 |
| 2018 | 509.7 | 87.7 |
| 2019 | 247.7 | 86.8 |
| 2020 | 965.2 | 87 |
| 2021 | 138.8 | 84.7 |
| 2022 | 89.7 | 79 |
| 2023 | 108.3 | 88.5 |
| 2024 | 174.2 | 99.7 |
Scroll for more →
| Year | With major event days | Without major event days |
|---|---|---|
| 2014 | 0.953 | 0.868 |
| 2015 | 0.991 | 0.833 |
| 2016 | 1.154 | 0.98 |
| 2017 | 0.934 | 0.875 |
| 2018 | 1.421 | 0.964 |
| 2019 | 1.19 | 0.942 |
| 2020 | 1.583 | 0.938 |
| 2021 | 1 | 0.885 |
| 2022 | 0.875 | 0.838 |
| 2023 | 0.881 | 0.831 |
| 2024 | 1.119 | 0.948 |
Scroll for more →
| Year | With major event days | Without major event days |
|---|---|---|
| 2014 | 117.5 | 90.7 |
| 2015 | 262.9 | 77.5 |
| 2016 | 118.9 | 87.5 |
| 2017 | 91.8 | 81.7 |
| 2018 | 358.6 | 90.9 |
| 2019 | 208.1 | 92.1 |
| 2020 | 609.8 | 92.8 |
| 2021 | 138.8 | 95.7 |
| 2022 | 102.4 | 94.3 |
| 2023 | 123 | 106.5 |
| 2024 | 155.7 | 105.2 |
Scroll for more →
New Mexico — 2014–2024 history
Direct link to New Mexico · Choose another state
New Mexico: IEEE
| Year | With major event days | Without major event days | Loss of supply removed |
|---|---|---|---|
| 2014 | 74.5 | 76.3 | 27 |
| 2015 | 108.8 | 95.6 | 53.3 |
| 2016 | 130.4 | 102.2 | 103.3 |
| 2017 | 121.2 | 114.5 | 105.1 |
| 2018 | 132.9 | 123.9 | 118.1 |
| 2019 | 158.2 | 121.5 | 141.6 |
| 2020 | 140.1 | 113.6 | 136.4 |
| 2021 | 204.3 | 120 | 190.9 |
| 2022 | 175.2 | 125.4 | 134.6 |
| 2023 | 156 | 123.7 | 139 |
| 2024 | 272.6 | 152 | 255.4 |
Scroll for more →
| Year | With major event days | Without major event days | Loss of supply removed |
|---|---|---|---|
| 2014 | 0.812 | 0.795 | 0.261 |
| 2015 | 0.961 | 0.905 | 0.389 |
| 2016 | 1.34 | 1.016 | 0.928 |
| 2017 | 1.242 | 1.061 | 0.876 |
| 2018 | 1.113 | 1.098 | 0.899 |
| 2019 | 1.113 | 1.028 | 0.934 |
| 2020 | 0.92 | 0.865 | 0.86 |
| 2021 | 1.239 | 1.04 | 1.074 |
| 2022 | 1.089 | 0.963 | 1 |
| 2023 | 1.102 | 0.908 | 0.966 |
| 2024 | 1.325 | 1.106 | 1.128 |
Scroll for more →
| Year | With major event days | Without major event days | Loss of supply removed |
|---|---|---|---|
| 2014 | 91.7 | 95.9 | 103.6 |
| 2015 | 113.3 | 105.6 | 137.2 |
| 2016 | 97.3 | 100.6 | 111.3 |
| 2017 | 97.6 | 107.9 | 119.9 |
| 2018 | 119.4 | 112.9 | 131.4 |
| 2019 | 142.1 | 118.2 | 151.7 |
| 2020 | 152.2 | 131.4 | 158.6 |
| 2021 | 164.9 | 115.4 | 177.8 |
| 2022 | 160.9 | 130.3 | 134.5 |
| 2023 | 141.6 | 136.3 | 143.9 |
| 2024 | 205.7 | 137.4 | 226.5 |
Scroll for more →
New Mexico: Any Method
| Year | With major event days | Without major event days |
|---|---|---|
| 2014 | 82.4 | 79.8 |
| 2015 | 122.3 | 99.2 |
| 2016 | 136.3 | 104.1 |
| 2017 | 140.6 | 115.7 |
| 2018 | 138.3 | 126 |
| 2019 | 170.2 | 128.4 |
| 2020 | 148.2 | 118.8 |
| 2021 | 221.2 | 131.7 |
| 2022 | 182.6 | 129.1 |
| 2023 | 168.9 | 132.3 |
| 2024 | 278.8 | 156.5 |
Scroll for more →
| Year | With major event days | Without major event days |
|---|---|---|
| 2014 | 0.846 | 0.825 |
| 2015 | 1.13 | 1.033 |
| 2016 | 1.452 | 1.117 |
| 2017 | 1.297 | 1.094 |
| 2018 | 1.146 | 1.118 |
| 2019 | 1.213 | 1.098 |
| 2020 | 1.01 | 0.933 |
| 2021 | 1.446 | 1.218 |
| 2022 | 1.166 | 1.005 |
| 2023 | 1.242 | 0.997 |
| 2024 | 1.321 | 1.109 |
Scroll for more →
| Year | With major event days | Without major event days |
|---|---|---|
| 2014 | 97.4 | 96.7 |
| 2015 | 108.2 | 96 |
| 2016 | 93.9 | 93.2 |
| 2017 | 108.4 | 105.8 |
| 2018 | 120.6 | 112.8 |
| 2019 | 140.3 | 116.9 |
| 2020 | 146.7 | 127.3 |
| 2021 | 152.9 | 108.1 |
| 2022 | 156.5 | 128.4 |
| 2023 | 136 | 132.7 |
| 2024 | 211.1 | 141.1 |
Scroll for more →
New York — 2014–2024 history
Direct link to New York · Choose another state
New York: IEEE
| Year | With major event days | Without major event days | Loss of supply removed |
|---|---|---|---|
| 2014 | 198 | 116 | 198 |
| 2015 | 146.4 | 137.6 | 143 |
| 2016 | 206.1 | 160.2 | 185.1 |
| 2017 | 344.5 | 132.1 | 350 |
| 2018 | 396.5 | 145.2 | 402.7 |
| 2019 | 323.7 | 136.9 | 327.5 |
| 2020 | 447.4 | 142.1 | 455.1 |
| 2021 | 218.8 | 131.5 | 221 |
| 2022 | 347.7 | 150 | 354 |
| 2023 | 204.8 | 130.1 | 207.5 |
| 2024 | 477.3 | 142.8 | 483.6 |
Scroll for more →
| Year | With major event days | Without major event days | Loss of supply removed |
|---|---|---|---|
| 2014 | 1.15 | 0.96 | 1.15 |
| 2015 | 1.173 | 1.135 | 1.137 |
| 2016 | 1.313 | 1.19 | 1.235 |
| 2017 | 1.397 | 1.02 | 1.412 |
| 2018 | 1.518 | 1.056 | 1.532 |
| 2019 | 1.475 | 1.044 | 1.487 |
| 2020 | 1.479 | 1.077 | 1.497 |
| 2021 | 1.311 | 1.109 | 1.31 |
| 2022 | 1.466 | 1.162 | 1.489 |
| 2023 | 1.127 | 0.963 | 1.14 |
| 2024 | 1.668 | 1.063 | 1.661 |
Scroll for more →
| Year | With major event days | Without major event days | Loss of supply removed |
|---|---|---|---|
| 2014 | 172.2 | 120.8 | 172.2 |
| 2015 | 124.8 | 121.2 | 125.7 |
| 2016 | 157 | 134.7 | 149.9 |
| 2017 | 246.6 | 129.5 | 247.9 |
| 2018 | 261.2 | 137.4 | 262.8 |
| 2019 | 219.5 | 131.2 | 220.2 |
| 2020 | 302.4 | 131.9 | 304 |
| 2021 | 166.8 | 118.5 | 168.7 |
| 2022 | 237.2 | 129.1 | 237.7 |
| 2023 | 181.7 | 135.1 | 182 |
| 2024 | 286.1 | 134.4 | 291.1 |
Scroll for more →
New York: Any Method
| Year | With major event days | Without major event days |
|---|---|---|
| 2014 | 92.7 | 63.4 |
| 2015 | 86.5 | 76 |
| 2016 | 107.2 | 82.2 |
| 2017 | 227.3 | 72 |
| 2018 | 405.5 | 79.2 |
| 2019 | 171 | 78.9 |
| 2020 | 407.7 | 79.8 |
| 2021 | 142 | 80.3 |
| 2022 | 203 | 77.6 |
| 2023 | 120 | 70 |
| 2024 | 219.9 | 72 |
Scroll for more →
| Year | With major event days | Without major event days |
|---|---|---|
| 2014 | 0.635 | 0.552 |
| 2015 | 0.671 | 0.64 |
| 2016 | 0.783 | 0.694 |
| 2017 | 0.844 | 0.62 |
| 2018 | 1.005 | 0.648 |
| 2019 | 0.876 | 0.635 |
| 2020 | 0.975 | 0.683 |
| 2021 | 0.854 | 0.686 |
| 2022 | 0.872 | 0.666 |
| 2023 | 0.725 | 0.586 |
| 2024 | 0.91 | 0.611 |
Scroll for more →
| Year | With major event days | Without major event days |
|---|---|---|
| 2014 | 145.9 | 114.9 |
| 2015 | 128.9 | 118.8 |
| 2016 | 137 | 118.5 |
| 2017 | 269.3 | 116 |
| 2018 | 403.4 | 122.3 |
| 2019 | 195.2 | 124.2 |
| 2020 | 418.1 | 116.9 |
| 2021 | 166.3 | 117.1 |
| 2022 | 232.7 | 116.5 |
| 2023 | 165.6 | 119.4 |
| 2024 | 241.7 | 117.8 |
Scroll for more →
North Carolina — 2014–2024 history
Direct link to North Carolina · Choose another state
North Carolina: IEEE
| Year | With major event days | Without major event days | Loss of supply removed |
|---|---|---|---|
| 2014 | 519 | 118.7 | 471.1 |
| 2015 | 220.8 | 131.3 | 200.5 |
| 2016 | 857.5 | 152.1 | 852.6 |
| 2017 | 282.2 | 151.1 | 253.4 |
| 2018 | 1877.6 | 168 | 1670.3 |
| 2019 | 287.5 | 147 | 266.1 |
| 2020 | 437.4 | 146 | 414.4 |
| 2021 | 215.2 | 125.9 | 207.3 |
| 2022 | 486 | 150.7 | 423.1 |
| 2023 | 262.5 | 156.4 | 249.9 |
| 2024 | 1518.1 | 143.9 | 1475 |
Scroll for more →
| Year | With major event days | Without major event days | Loss of supply removed |
|---|---|---|---|
| 2014 | 1.512 | 1.015 | 1.302 |
| 2015 | 1.383 | 1.142 | 1.227 |
| 2016 | 1.856 | 1.149 | 1.759 |
| 2017 | 1.381 | 1.162 | 1.209 |
| 2018 | 2.284 | 1.168 | 2.041 |
| 2019 | 1.449 | 1.114 | 1.278 |
| 2020 | 1.718 | 1.21 | 1.525 |
| 2021 | 1.249 | 1.065 | 1.152 |
| 2022 | 1.97 | 1.238 | 1.788 |
| 2023 | 1.526 | 1.282 | 1.399 |
| 2024 | 1.826 | 1.176 | 1.678 |
Scroll for more →
| Year | With major event days | Without major event days | Loss of supply removed |
|---|---|---|---|
| 2014 | 343.3 | 116.9 | 361.7 |
| 2015 | 159.7 | 115 | 163.5 |
| 2016 | 461.9 | 132.4 | 484.7 |
| 2017 | 204.4 | 130.1 | 209.6 |
| 2018 | 822.2 | 143.8 | 818.6 |
| 2019 | 198.4 | 132 | 208.3 |
| 2020 | 254.6 | 120.7 | 271.8 |
| 2021 | 172.3 | 118.2 | 179.9 |
| 2022 | 246.7 | 121.6 | 236.6 |
| 2023 | 172.1 | 121.9 | 178.6 |
| 2024 | 831.3 | 122.4 | 879.2 |
Scroll for more →
North Carolina: Any Method
| Year | With major event days | Without major event days |
|---|---|---|
| 2014 | 481.9 | 117.1 |
| 2015 | 210.6 | 128.2 |
| 2016 | 824.6 | 148.6 |
| 2017 | 264 | 146.3 |
| 2018 | 1761.5 | 162.3 |
| 2019 | 287.6 | 146.2 |
| 2020 | 417.9 | 143.7 |
| 2021 | 205.5 | 123.6 |
| 2022 | 456.3 | 148.6 |
| 2023 | 252 | 153.5 |
| 2024 | 1441 | 141.4 |
Scroll for more →
| Year | With major event days | Without major event days |
|---|---|---|
| 2014 | 1.471 | 1.009 |
| 2015 | 1.336 | 1.117 |
| 2016 | 1.79 | 1.138 |
| 2017 | 1.334 | 1.137 |
| 2018 | 2.168 | 1.147 |
| 2019 | 1.437 | 1.109 |
| 2020 | 1.697 | 1.206 |
| 2021 | 1.242 | 1.066 |
| 2022 | 1.927 | 1.236 |
| 2023 | 1.506 | 1.274 |
| 2024 | 1.812 | 1.172 |
Scroll for more →
| Year | With major event days | Without major event days |
|---|---|---|
| 2014 | 327.5 | 116.1 |
| 2015 | 157.6 | 114.8 |
| 2016 | 460.8 | 130.5 |
| 2017 | 197.9 | 128.7 |
| 2018 | 812.7 | 141.5 |
| 2019 | 200.1 | 131.9 |
| 2020 | 246.3 | 119.2 |
| 2021 | 165.4 | 116 |
| 2022 | 236.8 | 120.2 |
| 2023 | 167.4 | 120.5 |
| 2024 | 795 | 120.6 |
Scroll for more →
North Dakota — 2014–2024 history
Direct link to North Dakota · Choose another state
North Dakota: IEEE
| Year | With major event days | Without major event days | Loss of supply removed |
|---|---|---|---|
| 2014 | 102.5 | 91.6 | 76.7 |
| 2015 | 113.6 | 101 | 80.2 |
| 2016 | 152.8 | 110.4 | 147.1 |
| 2017 | 91.2 | 70.4 | 81.8 |
| 2018 | 111.2 | 96 | 83.8 |
| 2019 | 132.6 | 77.1 | 131.6 |
| 2020 | 123.3 | 86.8 | 113.3 |
| 2021 | 101.6 | 88.4 | 77 |
| 2022 | 677.6 | 102.8 | 789.8 |
| 2023 | 262.3 | 93.9 | 259 |
| 2024 | 102.7 | 87 | 82.2 |
Scroll for more →
| Year | With major event days | Without major event days | Loss of supply removed |
|---|---|---|---|
| 2014 | 1.797 | 1.725 | 0.957 |
| 2015 | 2.38 | 2.319 | 0.713 |
| 2016 | 2.063 | 1.932 | 1.046 |
| 2017 | 1.039 | 0.943 | 0.675 |
| 2018 | 0.954 | 0.874 | 0.693 |
| 2019 | 1.006 | 0.832 | 0.785 |
| 2020 | 1.151 | 1 | 0.814 |
| 2021 | 1.003 | 0.956 | 0.643 |
| 2022 | 1.425 | 1.065 | 1.126 |
| 2023 | 1.151 | 0.942 | 0.843 |
| 2024 | 0.942 | 0.881 | 0.681 |
Scroll for more →
| Year | With major event days | Without major event days | Loss of supply removed |
|---|---|---|---|
| 2014 | 57 | 53.1 | 80.2 |
| 2015 | 47.7 | 43.6 | 112.4 |
| 2016 | 74 | 57.1 | 140.6 |
| 2017 | 87.8 | 74.7 | 121.2 |
| 2018 | 116.6 | 109.8 | 120.8 |
| 2019 | 131.8 | 92.6 | 167.6 |
| 2020 | 107.2 | 86.9 | 139.3 |
| 2021 | 101.3 | 92.5 | 119.8 |
| 2022 | 475.5 | 96.6 | 701.2 |
| 2023 | 227.9 | 99.7 | 307.2 |
| 2024 | 109 | 98.7 | 120.7 |
Scroll for more →
North Dakota: Any Method
| Year | With major event days | Without major event days |
|---|---|---|
| 2014 | 87 | 87 |
| 2015 | 113.9 | 99 |
| 2016 | 123.8 | 108.3 |
| 2017 | 85.9 | 67.5 |
| 2018 | 94.4 | 95.2 |
| 2019 | 107.1 | 74.3 |
| 2020 | 101.1 | 82.5 |
| 2021 | 85.4 | 85.9 |
| 2022 | 559.6 | 99.6 |
| 2023 | 208.6 | 89.9 |
| 2024 | 99.1 | 84.2 |
Scroll for more →
| Year | With major event days | Without major event days |
|---|---|---|
| 2014 | 1.419 | 1.725 |
| 2015 | 2.074 | 2.319 |
| 2016 | 1.614 | 1.852 |
| 2017 | 0.966 | 0.897 |
| 2018 | 0.914 | 0.888 |
| 2019 | 0.87 | 0.819 |
| 2020 | 0.972 | 0.953 |
| 2021 | 0.879 | 0.968 |
| 2022 | 1.297 | 1.036 |
| 2023 | 1.055 | 0.907 |
| 2024 | 0.915 | 0.857 |
Scroll for more →
| Year | With major event days | Without major event days |
|---|---|---|
| 2014 | 61.3 | 50.5 |
| 2015 | 54.9 | 42.7 |
| 2016 | 76.7 | 58.5 |
| 2017 | 88.9 | 75.2 |
| 2018 | 103.4 | 107.2 |
| 2019 | 123 | 90.7 |
| 2020 | 104 | 86.6 |
| 2021 | 97.2 | 88.7 |
| 2022 | 431.4 | 96.1 |
| 2023 | 197.7 | 99.1 |
| 2024 | 108.4 | 98.3 |
Scroll for more →
Ohio — 2014–2024 history
Direct link to Ohio · Choose another state
Ohio: IEEE
| Year | With major event days | Without major event days | Loss of supply removed |
|---|---|---|---|
| 2014 | 185.5 | 131.4 | 142.1 |
| 2015 | 167.5 | 139.4 | 149.8 |
| 2016 | 169.5 | 127.1 | 142.1 |
| 2017 | 246.8 | 141.8 | 225.1 |
| 2018 | 240.3 | 150.1 | 210.4 |
| 2019 | 303.8 | 145.2 | 277.4 |
| 2020 | 283.6 | 129.2 | 261.5 |
| 2021 | 244.9 | 136 | 191.7 |
| 2022 | 413.6 | 144.1 | 318.9 |
| 2023 | 366.6 | 127.1 | 336 |
| 2024 | 511 | 133.3 | 500.3 |
Scroll for more →
| Year | With major event days | Without major event days | Loss of supply removed |
|---|---|---|---|
| 2014 | 1.197 | 1.107 | 1.006 |
| 2015 | 1.193 | 1.128 | 1.021 |
| 2016 | 1.181 | 1.058 | 0.989 |
| 2017 | 1.351 | 1.134 | 1.149 |
| 2018 | 1.408 | 1.174 | 1.16 |
| 2019 | 1.475 | 1.136 | 1.224 |
| 2020 | 1.356 | 1.073 | 1.168 |
| 2021 | 1.33 | 1.12 | 1.099 |
| 2022 | 1.518 | 1.122 | 1.204 |
| 2023 | 1.252 | 0.918 | 1.075 |
| 2024 | 1.298 | 0.999 | 1.124 |
Scroll for more →
| Year | With major event days | Without major event days | Loss of supply removed |
|---|---|---|---|
| 2014 | 155 | 118.7 | 141.3 |
| 2015 | 140.4 | 123.6 | 146.8 |
| 2016 | 143.5 | 120.2 | 143.7 |
| 2017 | 182.7 | 125 | 195.9 |
| 2018 | 170.7 | 127.9 | 181.3 |
| 2019 | 206.1 | 127.8 | 226.7 |
| 2020 | 209.1 | 120.5 | 224 |
| 2021 | 184.1 | 121.4 | 174.5 |
| 2022 | 272.4 | 128.5 | 264.8 |
| 2023 | 292.7 | 138.4 | 312.6 |
| 2024 | 393.7 | 133.4 | 445.1 |
Scroll for more →
Ohio: Any Method
| Year | With major event days | Without major event days |
|---|---|---|
| 2014 | 187.9 | 131.8 |
| 2015 | 172.1 | 141 |
| 2016 | 174.1 | 128.9 |
| 2017 | 248.4 | 143.4 |
| 2018 | 242 | 151.5 |
| 2019 | 305.2 | 146 |
| 2020 | 283.4 | 129.2 |
| 2021 | 244.2 | 135.9 |
| 2022 | 413.2 | 144 |
| 2023 | 366.2 | 127 |
| 2024 | 510.5 | 133.2 |
Scroll for more →
| Year | With major event days | Without major event days |
|---|---|---|
| 2014 | 1.209 | 1.113 |
| 2015 | 1.205 | 1.141 |
| 2016 | 1.184 | 1.065 |
| 2017 | 1.354 | 1.137 |
| 2018 | 1.411 | 1.178 |
| 2019 | 1.474 | 1.136 |
| 2020 | 1.356 | 1.073 |
| 2021 | 1.326 | 1.121 |
| 2022 | 1.517 | 1.121 |
| 2023 | 1.252 | 0.918 |
| 2024 | 1.298 | 0.999 |
Scroll for more →
| Year | With major event days | Without major event days |
|---|---|---|
| 2014 | 155.4 | 118.5 |
| 2015 | 142.8 | 123.6 |
| 2016 | 147.1 | 121 |
| 2017 | 183.6 | 126.1 |
| 2018 | 171.6 | 128.6 |
| 2019 | 207.1 | 128.5 |
| 2020 | 209 | 120.4 |
| 2021 | 184.1 | 121.2 |
| 2022 | 272.4 | 128.4 |
| 2023 | 292.5 | 138.4 |
| 2024 | 393.4 | 133.4 |
Scroll for more →
Oklahoma — 2014–2024 history
Direct link to Oklahoma · Choose another state
Oklahoma: IEEE
| Year | With major event days | Without major event days | Loss of supply removed |
|---|---|---|---|
| 2014 | 115.9 | 102.6 | 92.1 |
| 2015 | 597 | 123.1 | 346 |
| 2016 | 326.3 | 122.3 | 316.1 |
| 2017 | 194 | 118 | 147.8 |
| 2018 | 154.7 | 113.9 | 135.5 |
| 2019 | 186.2 | 138.4 | 153.5 |
| 2020 | 565.1 | 139.3 | 475.5 |
| 2021 | 165.9 | 126.2 | 132.9 |
| 2022 | 165.6 | 122.4 | 141.7 |
| 2023 | 1339.4 | 123.8 | 1012.7 |
| 2024 | 220.7 | 121.3 | 188.1 |
Scroll for more →
| Year | With major event days | Without major event days | Loss of supply removed |
|---|---|---|---|
| 2014 | 1.117 | 1.085 | 0.94 |
| 2015 | 1.87 | 1.282 | 1.582 |
| 2016 | 1.69 | 1.296 | 1.352 |
| 2017 | 1.463 | 1.184 | 1.184 |
| 2018 | 1.449 | 1.202 | 1.218 |
| 2019 | 1.6 | 1.338 | 1.271 |
| 2020 | 1.787 | 1.199 | 1.428 |
| 2021 | 1.519 | 1.272 | 1.163 |
| 2022 | 1.452 | 1.264 | 1.169 |
| 2023 | 2.079 | 1.134 | 1.713 |
| 2024 | 1.584 | 1.265 | 1.251 |
Scroll for more →
| Year | With major event days | Without major event days | Loss of supply removed |
|---|---|---|---|
| 2014 | 103.8 | 94.5 | 98 |
| 2015 | 319.2 | 96 | 218.7 |
| 2016 | 193 | 94.4 | 233.9 |
| 2017 | 132.6 | 99.7 | 124.9 |
| 2018 | 106.7 | 94.8 | 111.2 |
| 2019 | 116.4 | 103.4 | 120.8 |
| 2020 | 316.2 | 116.2 | 332.9 |
| 2021 | 109.2 | 99.2 | 114.3 |
| 2022 | 114 | 96.9 | 121.2 |
| 2023 | 644.3 | 109.2 | 591.2 |
| 2024 | 139.3 | 95.9 | 150.4 |
Scroll for more →
Oklahoma: Any Method
| Year | With major event days | Without major event days |
|---|---|---|
| 2014 | 119.1 | 104.1 |
| 2015 | 831.4 | 166.8 |
| 2016 | 316.6 | 149.5 |
| 2017 | 291.2 | 140.6 |
| 2018 | 175.6 | 127.2 |
| 2019 | 334.9 | 139 |
| 2020 | 2922 | 144.3 |
| 2021 | 179.4 | 146.5 |
| 2022 | 195.6 | 144.2 |
| 2023 | 896.6 | 139.3 |
| 2024 | 270.9 | 119.6 |
Scroll for more →
| Year | With major event days | Without major event days |
|---|---|---|
| 2014 | 1.075 | 1.027 |
| 2015 | 1.782 | 1.174 |
| 2016 | 1.582 | 1.253 |
| 2017 | 1.445 | 1.151 |
| 2018 | 1.331 | 1.134 |
| 2019 | 1.53 | 1.149 |
| 2020 | 2.111 | 1.101 |
| 2021 | 1.4 | 1.244 |
| 2022 | 1.442 | 1.266 |
| 2023 | 1.862 | 1.143 |
| 2024 | 1.731 | 1.147 |
Scroll for more →
| Year | With major event days | Without major event days |
|---|---|---|
| 2014 | 110.8 | 101.4 |
| 2015 | 466.5 | 142.1 |
| 2016 | 200.2 | 119.2 |
| 2017 | 201.6 | 122.1 |
| 2018 | 131.9 | 112.2 |
| 2019 | 218.9 | 121 |
| 2020 | 1384.5 | 131.1 |
| 2021 | 128.1 | 117.8 |
| 2022 | 135.6 | 113.9 |
| 2023 | 481.6 | 121.8 |
| 2024 | 156.5 | 104.3 |
Scroll for more →
Oregon — 2014–2024 history
Direct link to Oregon · Choose another state
Oregon: IEEE
| Year | With major event days | Without major event days | Loss of supply removed |
|---|---|---|---|
| 2014 | 259.9 | 108.1 | 227.3 |
| 2015 | 225.9 | 102.2 | 220.5 |
| 2016 | 233.5 | 101.1 | 175.8 |
| 2017 | 314.5 | 111.6 | 315.6 |
| 2018 | 111.4 | 90.3 | 103.6 |
| 2019 | 230.4 | 101.6 | 224.4 |
| 2020 | 325.9 | 103.4 | 317.9 |
| 2021 | 1588.3 | 113.9 | 1500.8 |
| 2022 | 325.2 | 121 | 304 |
| 2023 | 122.9 | 103.5 | 115.9 |
| 2024 | 579.3 | 124.1 | 547 |
Scroll for more →
| Year | With major event days | Without major event days | Loss of supply removed |
|---|---|---|---|
| 2014 | 1.346 | 0.88 | 1.061 |
| 2015 | 1.051 | 0.711 | 1.026 |
| 2016 | 1.105 | 0.778 | 1.029 |
| 2017 | 1.344 | 0.859 | 1.302 |
| 2018 | 0.9 | 0.795 | 0.842 |
| 2019 | 0.989 | 0.747 | 0.919 |
| 2020 | 1.13 | 0.749 | 1.075 |
| 2021 | 1.604 | 0.758 | 1.473 |
| 2022 | 1.311 | 0.804 | 1.215 |
| 2023 | 0.808 | 0.738 | 0.753 |
| 2024 | 1.324 | 0.824 | 1.197 |
Scroll for more →
| Year | With major event days | Without major event days | Loss of supply removed |
|---|---|---|---|
| 2014 | 193 | 122.8 | 214.2 |
| 2015 | 215 | 143.7 | 214.9 |
| 2016 | 211.4 | 130 | 170.8 |
| 2017 | 234 | 130 | 242.5 |
| 2018 | 123.8 | 113.6 | 123 |
| 2019 | 232.9 | 136.1 | 244.1 |
| 2020 | 288.4 | 138.1 | 295.7 |
| 2021 | 990.2 | 150.2 | 1019 |
| 2022 | 248.1 | 150.5 | 250.3 |
| 2023 | 152.1 | 140.4 | 153.9 |
| 2024 | 437.6 | 150.6 | 457 |
Scroll for more →
Oregon: Any Method
| Year | With major event days | Without major event days |
|---|---|---|
| 2014 | 289.3 | 107 |
| 2015 | 212.6 | 102.1 |
| 2016 | 240.3 | 100.5 |
| 2017 | 295.7 | 111.2 |
| 2018 | 113.1 | 92.5 |
| 2019 | 221.6 | 103.6 |
| 2020 | 311 | 104.4 |
| 2021 | 1489.2 | 116.5 |
| 2022 | 322.9 | 123.4 |
| 2023 | 126.9 | 108 |
| 2024 | 591 | 130.9 |
Scroll for more →
| Year | With major event days | Without major event days |
|---|---|---|
| 2014 | 1.271 | 0.869 |
| 2015 | 1.006 | 0.717 |
| 2016 | 1.091 | 0.776 |
| 2017 | 1.318 | 0.867 |
| 2018 | 0.916 | 0.804 |
| 2019 | 0.996 | 0.745 |
| 2020 | 1.142 | 0.753 |
| 2021 | 1.571 | 0.764 |
| 2022 | 1.288 | 0.813 |
| 2023 | 0.825 | 0.751 |
| 2024 | 1.346 | 0.857 |
Scroll for more →
| Year | With major event days | Without major event days |
|---|---|---|
| 2014 | 227.5 | 123.2 |
| 2015 | 211.2 | 142.4 |
| 2016 | 220.3 | 129.6 |
| 2017 | 224.4 | 128.3 |
| 2018 | 123.4 | 115.1 |
| 2019 | 222.5 | 139 |
| 2020 | 272.4 | 138.6 |
| 2021 | 947.7 | 152.5 |
| 2022 | 250.8 | 151.9 |
| 2023 | 153.8 | 143.7 |
| 2024 | 439.1 | 152.8 |
Scroll for more →
Pennsylvania — 2014–2024 history
Direct link to Pennsylvania · Choose another state
Pennsylvania: IEEE
| Year | With major event days | Without major event days | Loss of supply removed |
|---|---|---|---|
| 2014 | 438.3 | 104.1 | 426.9 |
| 2015 | 166.2 | 102.1 | 157.4 |
| 2016 | 132.3 | 105.1 | 122.1 |
| 2017 | 184.5 | 108.4 | 169.1 |
| 2018 | 564 | 122.8 | 551.3 |
| 2019 | 252.5 | 130.5 | 240.3 |
| 2020 | 355.4 | 107.5 | 343.6 |
| 2021 | 222.6 | 125.2 | 209.6 |
| 2022 | 207.5 | 125.4 | 195.1 |
| 2023 | 265.1 | 125.9 | 248.3 |
| 2024 | 353.1 | 131.5 | 340.9 |
Scroll for more →
| Year | With major event days | Without major event days | Loss of supply removed |
|---|---|---|---|
| 2014 | 1.282 | 0.952 | 1.143 |
| 2015 | 1.02 | 0.909 | 0.909 |
| 2016 | 1.092 | 0.973 | 1.011 |
| 2017 | 1.126 | 0.935 | 0.998 |
| 2018 | 1.489 | 1.044 | 1.35 |
| 2019 | 1.312 | 1.029 | 1.187 |
| 2020 | 1.336 | 0.939 | 1.215 |
| 2021 | 1.227 | 0.967 | 1.11 |
| 2022 | 1.163 | 0.975 | 1.059 |
| 2023 | 1.143 | 0.914 | 1.025 |
| 2024 | 1.393 | 0.989 | 1.278 |
Scroll for more →
| Year | With major event days | Without major event days | Loss of supply removed |
|---|---|---|---|
| 2014 | 341.8 | 109.4 | 373.7 |
| 2015 | 162.9 | 112.3 | 173 |
| 2016 | 121.2 | 107.9 | 120.7 |
| 2017 | 163.8 | 115.9 | 169.4 |
| 2018 | 378.8 | 117.6 | 408.3 |
| 2019 | 192.6 | 126.9 | 202.4 |
| 2020 | 266.1 | 114.5 | 282.8 |
| 2021 | 181.4 | 129.5 | 188.8 |
| 2022 | 178.3 | 128.6 | 184.2 |
| 2023 | 232 | 137.7 | 242.3 |
| 2024 | 253.5 | 133 | 266.7 |
Scroll for more →
Pennsylvania: Any Method
| Year | With major event days | Without major event days |
|---|---|---|
| 2014 | 399.6 | 99.7 |
| 2015 | 156.7 | 98.8 |
| 2016 | 126.2 | 101.4 |
| 2017 | 176.8 | 108.7 |
| 2018 | 518 | 119.3 |
| 2019 | 249.1 | 127.7 |
| 2020 | 334.2 | 107.8 |
| 2021 | 217.8 | 130.2 |
| 2022 | 200.4 | 126.1 |
| 2023 | 252.7 | 119.2 |
| 2024 | 336.1 | 131 |
Scroll for more →
| Year | With major event days | Without major event days |
|---|---|---|
| 2014 | 1.218 | 0.919 |
| 2015 | 0.994 | 0.891 |
| 2016 | 1.067 | 0.96 |
| 2017 | 1.109 | 0.938 |
| 2018 | 1.431 | 1.022 |
| 2019 | 1.309 | 1.025 |
| 2020 | 1.297 | 0.928 |
| 2021 | 1.2 | 0.963 |
| 2022 | 1.139 | 0.968 |
| 2023 | 1.108 | 0.878 |
| 2024 | 1.353 | 0.971 |
Scroll for more →
| Year | With major event days | Without major event days |
|---|---|---|
| 2014 | 328 | 108.5 |
| 2015 | 157.7 | 110.8 |
| 2016 | 118.2 | 105.6 |
| 2017 | 159.3 | 115.9 |
| 2018 | 362 | 116.7 |
| 2019 | 190.4 | 124.6 |
| 2020 | 257.6 | 116.1 |
| 2021 | 181.5 | 135.2 |
| 2022 | 175.9 | 130.4 |
| 2023 | 228 | 135.8 |
| 2024 | 248.3 | 134.9 |
Scroll for more →
Rhode Island — 2014–2024 history
Direct link to Rhode Island · Choose another state
Rhode Island: IEEE
| Year | With major event days | Without major event days | Loss of supply removed |
|---|---|---|---|
| 2014 | 54.2 | 54.2 | 54.2 |
| 2015 | 341.8 | 64.3 | 341.8 |
| 2016 | 168.9 | 69.1 | 163.2 |
| 2017 | 728.3 | 59.1 | 716.8 |
| 2018 | 594.8 | 65.1 | 537.4 |
| 2019 | 236.5 | 68.2 | 223.8 |
| 2020 | 548.4 | 69.1 | 452.9 |
| 2021 | 448.6 | 68.8 | 436 |
| 2022 | 81.9 | 63.2 | 81.1 |
| 2023 | 104.6 | 52.2 | 100.8 |
| 2024 | 104.3 | 60.8 | 99 |
Scroll for more →
| Year | With major event days | Without major event days | Loss of supply removed |
|---|---|---|---|
| 2014 | 0.762 | 0.762 | 0.76 |
| 2015 | 1.231 | 0.937 | 1.231 |
| 2016 | 1.206 | 0.973 | 1.046 |
| 2017 | 1.185 | 0.775 | 1.103 |
| 2018 | 1.57 | 1.001 | 1.394 |
| 2019 | 1.397 | 1.024 | 1.247 |
| 2020 | 1.966 | 0.945 | 1.442 |
| 2021 | 1.429 | 0.948 | 1.394 |
| 2022 | 0.959 | 0.808 | 0.932 |
| 2023 | 0.782 | 0.667 | 0.736 |
| 2024 | 0.896 | 0.761 | 0.862 |
Scroll for more →
| Year | With major event days | Without major event days | Loss of supply removed |
|---|---|---|---|
| 2014 | 71.1 | 71.1 | 71.3 |
| 2015 | 277.7 | 68.6 | 277.7 |
| 2016 | 140 | 71 | 156 |
| 2017 | 614.6 | 76.3 | 649.8 |
| 2018 | 378.8 | 65 | 385.5 |
| 2019 | 169.3 | 66.6 | 179.5 |
| 2020 | 278.9 | 73.1 | 314.1 |
| 2021 | 313.9 | 72.6 | 312.7 |
| 2022 | 85.4 | 78.2 | 87 |
| 2023 | 133.7 | 78.3 | 136.9 |
| 2024 | 116.4 | 79.9 | 114.9 |
Scroll for more →
Rhode Island: Any Method
| Year | With major event days | Without major event days |
|---|---|---|
| 2014 | 54.2 | 54.2 |
| 2015 | 341.8 | 64.3 |
| 2016 | 168.9 | 69.1 |
| 2017 | 728.3 | 59.1 |
| 2018 | 594.8 | 65.1 |
| 2019 | 236.5 | 68.2 |
| 2020 | 548.4 | 69.1 |
| 2021 | 448.6 | 68.8 |
| 2022 | 81.9 | 63.2 |
| 2023 | 104.6 | 52.2 |
| 2024 | 104.3 | 60.8 |
Scroll for more →
| Year | With major event days | Without major event days |
|---|---|---|
| 2014 | 0.762 | 0.762 |
| 2015 | 1.231 | 0.937 |
| 2016 | 1.206 | 0.973 |
| 2017 | 1.185 | 0.775 |
| 2018 | 1.57 | 1.001 |
| 2019 | 1.397 | 1.024 |
| 2020 | 1.966 | 0.945 |
| 2021 | 1.429 | 0.948 |
| 2022 | 0.959 | 0.808 |
| 2023 | 0.782 | 0.667 |
| 2024 | 0.896 | 0.761 |
Scroll for more →
| Year | With major event days | Without major event days |
|---|---|---|
| 2014 | 71.1 | 71.1 |
| 2015 | 277.7 | 68.6 |
| 2016 | 140 | 71 |
| 2017 | 614.6 | 76.3 |
| 2018 | 378.8 | 65 |
| 2019 | 169.3 | 66.6 |
| 2020 | 278.9 | 73.1 |
| 2021 | 313.9 | 72.6 |
| 2022 | 85.4 | 78.2 |
| 2023 | 133.7 | 78.3 |
| 2024 | 116.4 | 79.9 |
Scroll for more →
South Carolina — 2014–2024 history
Direct link to South Carolina · Choose another state
South Carolina: IEEE
| Year | With major event days | Without major event days | Loss of supply removed |
|---|---|---|---|
| 2014 | 787 | 102 | 777.9 |
| 2015 | 234.3 | 121.9 | 195.3 |
| 2016 | 1698.8 | 122.1 | 1663.3 |
| 2017 | 386.9 | 119.4 | 371.1 |
| 2018 | 488.6 | 138.8 | 463.6 |
| 2019 | 338.2 | 106.3 | 319.8 |
| 2020 | 332.6 | 121.3 | 308.9 |
| 2021 | 122.9 | 101.3 | 106.2 |
| 2022 | 302.4 | 114.8 | 274.4 |
| 2023 | 169.8 | 126.5 | 140.4 |
| 2024 | 3155 | 115.9 | 2972.9 |
Scroll for more →
| Year | With major event days | Without major event days | Loss of supply removed |
|---|---|---|---|
| 2014 | 1.853 | 1.132 | 1.623 |
| 2015 | 1.49 | 1.18 | 1.19 |
| 2016 | 2.445 | 1.226 | 2.175 |
| 2017 | 1.609 | 1.125 | 1.467 |
| 2018 | 1.77 | 1.238 | 1.496 |
| 2019 | 1.497 | 1.006 | 1.285 |
| 2020 | 1.482 | 1.129 | 1.227 |
| 2021 | 1.158 | 1.027 | 0.951 |
| 2022 | 1.87 | 1.154 | 1.571 |
| 2023 | 1.512 | 1.289 | 1.197 |
| 2024 | 2.368 | 1.198 | 2.054 |
Scroll for more →
| Year | With major event days | Without major event days | Loss of supply removed |
|---|---|---|---|
| 2014 | 424.7 | 90.1 | 479.4 |
| 2015 | 157.3 | 103.2 | 164.1 |
| 2016 | 694.7 | 99.5 | 764.9 |
| 2017 | 240.5 | 106.1 | 253 |
| 2018 | 276.1 | 112.1 | 309.9 |
| 2019 | 226 | 105.7 | 248.9 |
| 2020 | 224.4 | 107.5 | 251.8 |
| 2021 | 106.2 | 98.6 | 111.7 |
| 2022 | 161.7 | 99.4 | 174.7 |
| 2023 | 112.3 | 98.1 | 117.3 |
| 2024 | 1332.3 | 96.7 | 1447.2 |
Scroll for more →
South Carolina: Any Method
| Year | With major event days | Without major event days |
|---|---|---|
| 2014 | 799.5 | 100.1 |
| 2015 | 224.1 | 119.3 |
| 2016 | 1645.4 | 121.3 |
| 2017 | 372.8 | 117.8 |
| 2018 | 470.5 | 137 |
| 2019 | 326.5 | 105.6 |
| 2020 | 323.8 | 119.9 |
| 2021 | 120.9 | 100.7 |
| 2022 | 301.1 | 114.8 |
| 2023 | 167.2 | 126.1 |
| 2024 | 3136.5 | 117.8 |
Scroll for more →
| Year | With major event days | Without major event days |
|---|---|---|
| 2014 | 1.816 | 1.122 |
| 2015 | 1.454 | 1.166 |
| 2016 | 2.417 | 1.228 |
| 2017 | 1.585 | 1.115 |
| 2018 | 1.746 | 1.224 |
| 2019 | 1.483 | 1.004 |
| 2020 | 1.475 | 1.124 |
| 2021 | 1.161 | 1.031 |
| 2022 | 1.87 | 1.156 |
| 2023 | 1.507 | 1.291 |
| 2024 | 2.365 | 1.207 |
Scroll for more →
| Year | With major event days | Without major event days |
|---|---|---|
| 2014 | 440.3 | 89.2 |
| 2015 | 154.1 | 102.3 |
| 2016 | 680.7 | 98.8 |
| 2017 | 235.2 | 105.6 |
| 2018 | 269.4 | 111.9 |
| 2019 | 220.2 | 105.2 |
| 2020 | 219.6 | 106.7 |
| 2021 | 104.1 | 97.7 |
| 2022 | 161 | 99.3 |
| 2023 | 110.9 | 97.7 |
| 2024 | 1326.3 | 97.6 |
Scroll for more →
South Dakota — 2014–2024 history
Direct link to South Dakota · Choose another state
South Dakota: IEEE
| Year | With major event days | Without major event days | Loss of supply removed |
|---|---|---|---|
| 2014 | 120.6 | 107.9 | 93.5 |
| 2015 | 135 | 107.6 | 98.1 |
| 2016 | 255.8 | 84.4 | 119.1 |
| 2017 | 101.7 | 80.3 | 87.7 |
| 2018 | 93.1 | 73 | 75.7 |
| 2019 | 311.4 | 108.2 | 250.6 |
| 2020 | 97.4 | 71.5 | 86.7 |
| 2021 | 101.3 | 61.9 | 78.2 |
| 2022 | 338.3 | 126.3 | 244.7 |
| 2023 | 78.1 | 63.9 | 62.2 |
| 2024 | 85.6 | 61.5 | 67.5 |
Scroll for more →
| Year | With major event days | Without major event days | Loss of supply removed |
|---|---|---|---|
| 2014 | 1.048 | 0.964 | 0.698 |
| 2015 | 1.121 | 0.939 | 0.87 |
| 2016 | 1.362 | 0.998 | 0.88 |
| 2017 | 1.156 | 1.064 | 0.9 |
| 2018 | 1.108 | 0.928 | 0.696 |
| 2019 | 1.627 | 1.101 | 1.114 |
| 2020 | 1.094 | 0.896 | 0.745 |
| 2021 | 0.979 | 0.679 | 0.69 |
| 2022 | 1.204 | 0.793 | 0.89 |
| 2023 | 1.017 | 0.894 | 0.691 |
| 2024 | 0.815 | 0.72 | 0.582 |
Scroll for more →
| Year | With major event days | Without major event days | Loss of supply removed |
|---|---|---|---|
| 2014 | 115.1 | 111.9 | 134.1 |
| 2015 | 120.4 | 114.6 | 112.8 |
| 2016 | 187.8 | 84.5 | 135.3 |
| 2017 | 88 | 75.4 | 97.5 |
| 2018 | 84.1 | 78.6 | 108.9 |
| 2019 | 191.5 | 98.3 | 225 |
| 2020 | 89 | 79.9 | 116.3 |
| 2021 | 103.4 | 91.2 | 113.5 |
| 2022 | 281.1 | 159.4 | 274.9 |
| 2023 | 76.8 | 71.4 | 90.1 |
| 2024 | 105 | 85.4 | 116 |
Scroll for more →
South Dakota: Any Method
| Year | With major event days | Without major event days |
|---|---|---|
| 2014 | 115.8 | 106.2 |
| 2015 | 133.3 | 106.5 |
| 2016 | 252.2 | 83.8 |
| 2017 | 100.6 | 81.2 |
| 2018 | 92.1 | 74 |
| 2019 | 295 | 106.7 |
| 2020 | 97.3 | 73.2 |
| 2021 | 105.6 | 62.7 |
| 2022 | 327.1 | 123.5 |
| 2023 | 77 | 63.2 |
| 2024 | 84.7 | 62.1 |
Scroll for more →
| Year | With major event days | Without major event days |
|---|---|---|
| 2014 | 1.009 | 0.949 |
| 2015 | 1.133 | 0.926 |
| 2016 | 1.4 | 0.99 |
| 2017 | 1.152 | 1.049 |
| 2018 | 1.084 | 0.915 |
| 2019 | 1.576 | 1.094 |
| 2020 | 1.096 | 0.896 |
| 2021 | 1.009 | 0.679 |
| 2022 | 1.235 | 0.793 |
| 2023 | 1.011 | 0.894 |
| 2024 | 0.815 | 0.72 |
Scroll for more →
| Year | With major event days | Without major event days |
|---|---|---|
| 2014 | 114.9 | 111.9 |
| 2015 | 117.7 | 114.9 |
| 2016 | 180.2 | 84.6 |
| 2017 | 87.3 | 77.4 |
| 2018 | 84.9 | 80.9 |
| 2019 | 187.2 | 97.5 |
| 2020 | 88.8 | 81.8 |
| 2021 | 104.6 | 92.3 |
| 2022 | 264.9 | 155.8 |
| 2023 | 76.2 | 70.8 |
| 2024 | 104 | 86.2 |
Scroll for more →
Tennessee — 2014–2024 history
Direct link to Tennessee · Choose another state
Tennessee: IEEE
| Year | With major event days | Without major event days | Loss of supply removed |
|---|---|---|---|
| 2014 | 277.7 | 143.9 | 263 |
| 2015 | 257.5 | 134.6 | 256.3 |
| 2016 | 212.9 | 141.6 | 206.4 |
| 2017 | 621.5 | 141.7 | 603.1 |
| 2018 | 217.5 | 145.6 | 213.1 |
| 2019 | 252.9 | 160.4 | 251.6 |
| 2020 | 618.4 | 144.5 | 601.1 |
| 2021 | 316.8 | 151.7 | 299.5 |
| 2022 | 428.3 | 194.1 | 425.9 |
| 2023 | 926.9 | 192.7 | 933.4 |
| 2024 | 289.3 | 169.9 | 283.3 |
Scroll for more →
| Year | With major event days | Without major event days | Loss of supply removed |
|---|---|---|---|
| 2014 | 1.779 | 1.504 | 1.668 |
| 2015 | 1.787 | 1.504 | 1.738 |
| 2016 | 1.806 | 1.571 | 1.707 |
| 2017 | 1.865 | 1.473 | 1.753 |
| 2018 | 1.956 | 1.704 | 1.896 |
| 2019 | 2.134 | 1.783 | 2.065 |
| 2020 | 2.128 | 1.539 | 2.005 |
| 2021 | 2.007 | 1.69 | 1.824 |
| 2022 | 3.326 | 1.988 | 3.073 |
| 2023 | 2.803 | 1.891 | 2.773 |
| 2024 | 1.939 | 1.752 | 1.896 |
Scroll for more →
| Year | With major event days | Without major event days | Loss of supply removed |
|---|---|---|---|
| 2014 | 156.1 | 95.7 | 157.7 |
| 2015 | 144.1 | 89.5 | 147.4 |
| 2016 | 117.9 | 90.1 | 120.9 |
| 2017 | 333.2 | 96.2 | 344 |
| 2018 | 111.2 | 85.4 | 112.4 |
| 2019 | 118.5 | 90 | 121.8 |
| 2020 | 290.6 | 93.9 | 299.9 |
| 2021 | 157.9 | 89.8 | 164.2 |
| 2022 | 128.8 | 97.6 | 138.6 |
| 2023 | 330.7 | 101.9 | 336.5 |
| 2024 | 149.2 | 97 | 149.4 |
Scroll for more →
Tennessee: Any Method
| Year | With major event days | Without major event days |
|---|---|---|
| 2014 | 225 | 131 |
| 2015 | 222.4 | 124.9 |
| 2016 | 197.2 | 144.4 |
| 2017 | 512.8 | 142.4 |
| 2018 | 199.8 | 139.6 |
| 2019 | 266.9 | 161.4 |
| 2020 | 588 | 148.4 |
| 2021 | 302.7 | 149.4 |
| 2022 | 404.5 | 188.3 |
| 2023 | 857.9 | 186.1 |
| 2024 | 278.6 | 159.5 |
Scroll for more →
| Year | With major event days | Without major event days |
|---|---|---|
| 2014 | 1.803 | 1.552 |
| 2015 | 1.769 | 1.49 |
| 2016 | 1.78 | 1.566 |
| 2017 | 1.806 | 1.469 |
| 2018 | 1.901 | 1.689 |
| 2019 | 2.151 | 1.794 |
| 2020 | 2.14 | 1.573 |
| 2021 | 2.019 | 1.706 |
| 2022 | 3.196 | 1.949 |
| 2023 | 2.812 | 1.898 |
| 2024 | 2 | 1.764 |
Scroll for more →
| Year | With major event days | Without major event days |
|---|---|---|
| 2014 | 124.8 | 84.4 |
| 2015 | 125.8 | 83.8 |
| 2016 | 110.7 | 92.3 |
| 2017 | 284 | 97 |
| 2018 | 105.1 | 82.7 |
| 2019 | 124.1 | 90 |
| 2020 | 274.8 | 94.4 |
| 2021 | 149.9 | 87.6 |
| 2022 | 126.6 | 96.6 |
| 2023 | 305.1 | 98.1 |
| 2024 | 139.3 | 90.4 |
Scroll for more →
Texas — 2014–2024 history
Direct link to Texas · Choose another state
Texas: IEEE
| Year | With major event days | Without major event days | Loss of supply removed |
|---|---|---|---|
| 2014 | 198.6 | 118.6 | 206.6 |
| 2015 | 279.8 | 143 | 270.2 |
| 2016 | 216.8 | 132.7 | 208.7 |
| 2017 | 486.8 | 135.1 | 457.5 |
| 2018 | 170.4 | 130.2 | 165.9 |
| 2019 | 254.8 | 141.4 | 248.4 |
| 2020 | 419.4 | 132.7 | 426.3 |
| 2021 | 1496.4 | 174.7 | 683.7 |
| 2022 | 204.6 | 153.7 | 202.6 |
| 2023 | 583.1 | 150.3 | 604.3 |
| 2024 | 1614.3 | 153.4 | 1724.6 |
Scroll for more →
| Year | With major event days | Without major event days | Loss of supply removed |
|---|---|---|---|
| 2014 | 1.494 | 1.21 | 1.466 |
| 2015 | 1.843 | 1.338 | 1.733 |
| 2016 | 1.638 | 1.295 | 1.547 |
| 2017 | 1.691 | 1.3 | 1.531 |
| 2018 | 1.428 | 1.24 | 1.348 |
| 2019 | 1.66 | 1.281 | 1.549 |
| 2020 | 1.636 | 1.223 | 1.543 |
| 2021 | 3.33 | 1.382 | 3.525 |
| 2022 | 1.704 | 1.399 | 1.656 |
| 2023 | 1.889 | 1.39 | 1.777 |
| 2024 | 2.293 | 1.398 | 2.27 |
Scroll for more →
| Year | With major event days | Without major event days | Loss of supply removed |
|---|---|---|---|
| 2014 | 132.9 | 97.9 | 140.9 |
| 2015 | 151.8 | 106.8 | 155.9 |
| 2016 | 132.3 | 102.5 | 134.9 |
| 2017 | 287.8 | 103.9 | 298.8 |
| 2018 | 119.3 | 104.9 | 123 |
| 2019 | 153.5 | 110.4 | 160.4 |
| 2020 | 256.3 | 108.5 | 276.4 |
| 2021 | 449.4 | 126.5 | 194 |
| 2022 | 120.1 | 109.8 | 122.3 |
| 2023 | 308.7 | 108.1 | 340 |
| 2024 | 704.2 | 109.7 | 759.9 |
Scroll for more →
Texas: Any Method
| Year | With major event days | Without major event days |
|---|---|---|
| 2014 | 192.5 | 116.9 |
| 2015 | 271.7 | 139.1 |
| 2016 | 210.8 | 129.3 |
| 2017 | 477.6 | 133.8 |
| 2018 | 167.2 | 113.7 |
| 2019 | 290.7 | 121.8 |
| 2020 | 432.7 | 163.7 |
| 2021 | 1175.3 | 147.4 |
| 2022 | 212 | 127.5 |
| 2023 | 496.2 | 124.7 |
| 2024 | 1270.6 | 129.4 |
Scroll for more →
| Year | With major event days | Without major event days |
|---|---|---|
| 2014 | 1.441 | 1.187 |
| 2015 | 1.781 | 1.308 |
| 2016 | 1.599 | 1.27 |
| 2017 | 1.667 | 1.283 |
| 2018 | 1.389 | 1.089 |
| 2019 | 1.672 | 1.118 |
| 2020 | 2.222 | 1.486 |
| 2021 | 2.9 | 1.201 |
| 2022 | 1.654 | 1.203 |
| 2023 | 1.763 | 1.175 |
| 2024 | 2.114 | 1.218 |
Scroll for more →
| Year | With major event days | Without major event days |
|---|---|---|
| 2014 | 133.5 | 98.5 |
| 2015 | 152.6 | 106.3 |
| 2016 | 131.8 | 101.8 |
| 2017 | 286.5 | 104.3 |
| 2018 | 120.4 | 104.4 |
| 2019 | 173.8 | 108.9 |
| 2020 | 194.8 | 110.2 |
| 2021 | 405.2 | 122.7 |
| 2022 | 128.1 | 105.9 |
| 2023 | 281.5 | 106.1 |
| 2024 | 600.9 | 106.2 |
Scroll for more →
Utah — 2014–2024 history
Direct link to Utah · Choose another state
Utah: IEEE
| Year | With major event days | Without major event days | Loss of supply removed |
|---|---|---|---|
| 2014 | 193.9 | 151 | 167.9 |
| 2015 | 203.2 | 156.4 | 217.6 |
| 2016 | 193.4 | 106.1 | 206.4 |
| 2017 | 142.1 | 116.3 | 139.1 |
| 2018 | 115.5 | 115.5 | 119.8 |
| 2019 | 144.4 | 110.8 | 140.5 |
| 2020 | 591.8 | 100.9 | 614 |
| 2021 | 113.4 | 98 | 114.9 |
| 2022 | 108.7 | 96.6 | 103.4 |
| 2023 | 127.7 | 108.5 | 119.9 |
| 2024 | 115.4 | 105 | 108.9 |
Scroll for more →
| Year | With major event days | Without major event days | Loss of supply removed |
|---|---|---|---|
| 2014 | 1.373 | 1.211 | 1.139 |
| 2015 | 1.363 | 1.223 | 1.421 |
| 2016 | 1.313 | 0.972 | 1.357 |
| 2017 | 1.075 | 0.957 | 1.079 |
| 2018 | 1.008 | 1.005 | 1.022 |
| 2019 | 1.001 | 0.935 | 1.014 |
| 2020 | 1.319 | 0.87 | 1.316 |
| 2021 | 0.912 | 0.857 | 0.922 |
| 2022 | 0.858 | 0.82 | 0.857 |
| 2023 | 0.912 | 0.866 | 0.919 |
| 2024 | 1.008 | 0.956 | 1.002 |
Scroll for more →
| Year | With major event days | Without major event days | Loss of supply removed |
|---|---|---|---|
| 2014 | 141.2 | 124.8 | 147.5 |
| 2015 | 149.2 | 127.9 | 153.1 |
| 2016 | 147.3 | 109.1 | 152.1 |
| 2017 | 132.2 | 121.5 | 128.9 |
| 2018 | 114.6 | 115 | 117.1 |
| 2019 | 144.2 | 118.6 | 138.6 |
| 2020 | 448.7 | 115.9 | 466.5 |
| 2021 | 124.4 | 114.4 | 124.6 |
| 2022 | 126.6 | 117.8 | 120.6 |
| 2023 | 140 | 125.3 | 130.4 |
| 2024 | 114.5 | 109.9 | 108.7 |
Scroll for more →
Utah: Any Method
| Year | With major event days | Without major event days |
|---|---|---|
| 2014 | 187.2 | 148.9 |
| 2015 | 199.6 | 155.5 |
| 2016 | 190.1 | 105.6 |
| 2017 | 139 | 114.6 |
| 2018 | 125.3 | 126.6 |
| 2019 | 146.2 | 115.4 |
| 2020 | 575.1 | 101.5 |
| 2021 | 116 | 100.9 |
| 2022 | 111.3 | 100.4 |
| 2023 | 127.1 | 109.8 |
| 2024 | 119.8 | 106.7 |
Scroll for more →
| Year | With major event days | Without major event days |
|---|---|---|
| 2014 | 1.356 | 1.193 |
| 2015 | 1.35 | 1.219 |
| 2016 | 1.31 | 0.964 |
| 2017 | 1.065 | 0.945 |
| 2018 | 1.019 | 1.017 |
| 2019 | 0.998 | 0.941 |
| 2020 | 1.32 | 0.882 |
| 2021 | 0.934 | 0.873 |
| 2022 | 0.887 | 0.854 |
| 2023 | 0.916 | 0.879 |
| 2024 | 1.03 | 0.966 |
Scroll for more →
| Year | With major event days | Without major event days |
|---|---|---|
| 2014 | 138.1 | 124.9 |
| 2015 | 147.8 | 127.6 |
| 2016 | 145.1 | 109.5 |
| 2017 | 130.6 | 121.2 |
| 2018 | 122.9 | 124.5 |
| 2019 | 146.5 | 122.6 |
| 2020 | 435.6 | 115.1 |
| 2021 | 124.1 | 115.6 |
| 2022 | 125.5 | 117.5 |
| 2023 | 138.7 | 124.9 |
| 2024 | 116.3 | 110.4 |
Scroll for more →
Vermont — 2014–2024 history
Direct link to Vermont · Choose another state
Vermont: IEEE
| Year | With major event days | Without major event days | Loss of supply removed |
|---|---|---|---|
| 2014 | 240 | 180 | 240 |
| 2015 | 193.4 | 193.4 | 179.4 |
| 2016 | 198.8 | 198.8 | 187.4 |
| 2017 | 1792.4 | 186.2 | 1782.7 |
| 2018 | 929.8 | 357.7 | 732.1 |
| 2019 | 334 | 170.4 | 329.4 |
| 2020 | 158.4 | 158.4 | 151 |
| 2021 | 215.3 | 215.3 | 210.1 |
| 2022 | 914.6 | 178.5 | 877.6 |
| 2023 | 486.3 | 204.3 | 480.1 |
| 2024 | 895.8 | 231.8 | 884.6 |
Scroll for more →
| Year | With major event days | Without major event days | Loss of supply removed |
|---|---|---|---|
| 2014 | 2.521 | 1.388 | 2.331 |
| 2015 | 1.765 | 1.765 | 1.531 |
| 2016 | 1.552 | 1.552 | 1.372 |
| 2017 | 2.609 | 1.632 | 2.491 |
| 2018 | 3.39 | 2.34 | 2.86 |
| 2019 | 1.96 | 1.49 | 1.9 |
| 2020 | 1.63 | 1.63 | 1.56 |
| 2021 | 1.91 | 1.91 | 1.75 |
| 2022 | 2.44 | 1.95 | 2.26 |
| 2023 | 2.25 | 1.38 | 2.04 |
| 2024 | 3.34 | 1.4 | 2.06 |
Scroll for more →
| Year | With major event days | Without major event days | Loss of supply removed |
|---|---|---|---|
| 2014 | 95.2 | 129.7 | 103 |
| 2015 | 109.6 | 109.6 | 117.2 |
| 2016 | 128.1 | 128.1 | 136.6 |
| 2017 | 687.1 | 114.1 | 715.5 |
| 2018 | 274.3 | 152.8 | 256 |
| 2019 | 170.4 | 114.4 | 173.4 |
| 2020 | 97.2 | 97.2 | 96.8 |
| 2021 | 112.7 | 112.7 | 120.1 |
| 2022 | 374.8 | 91.5 | 388.3 |
| 2023 | 216.1 | 148.1 | 235.3 |
| 2024 | 268.2 | 165.6 | 429.4 |
Scroll for more →
Vermont: Any Method
| Year | With major event days | Without major event days |
|---|---|---|
| 2014 | 745 | 216.4 |
| 2015 | 204.2 | 205.6 |
| 2016 | 359.4 | 273.2 |
| 2017 | 873.9 | 246.4 |
| 2018 | 897.6 | 262.1 |
| 2019 | 443.8 | 170.1 |
| 2020 | 255.6 | 255.6 |
| 2021 | 313.2 | 262.4 |
| 2022 | 963.5 | 267.6 |
| 2023 | 744.4 | 221.3 |
| 2024 | 696.7 | 275 |
Scroll for more →
| Year | With major event days | Without major event days |
|---|---|---|
| 2014 | 2.195 | 1.492 |
| 2015 | 1.67 | 1.748 |
| 2016 | 1.862 | 1.8 |
| 2017 | 2.413 | 1.889 |
| 2018 | 2.619 | 1.908 |
| 2019 | 1.981 | 1.465 |
| 2020 | 1.898 | 1.926 |
| 2021 | 2.074 | 2.058 |
| 2022 | 2.62 | 1.967 |
| 2023 | 2.352 | 1.58 |
| 2024 | 2.516 | 1.661 |
Scroll for more →
| Year | With major event days | Without major event days |
|---|---|---|
| 2014 | 339.3 | 145.1 |
| 2015 | 122.3 | 117.6 |
| 2016 | 193.1 | 151.8 |
| 2017 | 362.1 | 130.4 |
| 2018 | 342.8 | 137.4 |
| 2019 | 224 | 116.2 |
| 2020 | 134.7 | 132.7 |
| 2021 | 151 | 127.5 |
| 2022 | 367.8 | 136 |
| 2023 | 316.5 | 140 |
| 2024 | 276.9 | 165.5 |
Scroll for more →
Virginia — 2014–2024 history
Direct link to Virginia · Choose another state
Virginia: IEEE
| Year | With major event days | Without major event days | Loss of supply removed |
|---|---|---|---|
| 2014 | 287.1 | 243 | 259.3 |
| 2015 | 249 | 208.5 | 231.8 |
| 2016 | 317.6 | 219.7 | 302.8 |
| 2017 | 279.2 | 218 | 232.1 |
| 2018 | 1133.7 | 307.8 | 1099.9 |
| 2019 | 478 | 285.4 | 439.2 |
| 2020 | 337.7 | 250.6 | 308.6 |
| 2021 | 798.2 | 262.7 | 793.3 |
| 2022 | 1108.2 | 342.3 | 1103.6 |
| 2023 | 292.8 | 239.9 | 280.6 |
| 2024 | 962.1 | 245.1 | 911.2 |
Scroll for more →
| Year | With major event days | Without major event days | Loss of supply removed |
|---|---|---|---|
| 2014 | 1.59 | 1.445 | 1.38 |
| 2015 | 1.548 | 1.449 | 1.418 |
| 2016 | 1.692 | 1.509 | 1.349 |
| 2017 | 1.617 | 1.443 | 1.51 |
| 2018 | 2.605 | 1.744 | 2.447 |
| 2019 | 2.091 | 1.7 | 1.943 |
| 2020 | 1.808 | 1.608 | 1.695 |
| 2021 | 1.981 | 1.565 | 1.883 |
| 2022 | 2.541 | 1.838 | 2.444 |
| 2023 | 1.655 | 1.522 | 1.561 |
| 2024 | 2.238 | 1.641 | 2.038 |
Scroll for more →
| Year | With major event days | Without major event days | Loss of supply removed |
|---|---|---|---|
| 2014 | 180.6 | 168.2 | 187.9 |
| 2015 | 160.9 | 143.9 | 163.5 |
| 2016 | 187.7 | 145.6 | 224.5 |
| 2017 | 172.7 | 151 | 153.7 |
| 2018 | 435.1 | 176.5 | 449.5 |
| 2019 | 228.6 | 167.9 | 226.1 |
| 2020 | 186.8 | 155.8 | 182 |
| 2021 | 402.9 | 167.9 | 421.3 |
| 2022 | 436.1 | 186.2 | 451.6 |
| 2023 | 176.9 | 157.6 | 179.8 |
| 2024 | 429.9 | 149.4 | 447 |
Scroll for more →
Virginia: Any Method
| Year | With major event days | Without major event days |
|---|---|---|
| 2014 | 187.3 | 148.3 |
| 2015 | 203.5 | 148 |
| 2016 | 237.7 | 164.8 |
| 2017 | 192.9 | 142.2 |
| 2018 | 507.4 | 187.8 |
| 2019 | 309 | 182.1 |
| 2020 | 308.6 | 165.3 |
| 2021 | 434.4 | 164.9 |
| 2022 | 593.9 | 187.5 |
| 2023 | 221.1 | 159.3 |
| 2024 | 418.3 | 166.4 |
Scroll for more →
| Year | With major event days | Without major event days |
|---|---|---|
| 2014 | 1.381 | 1.229 |
| 2015 | 1.429 | 1.245 |
| 2016 | 1.545 | 1.346 |
| 2017 | 1.375 | 1.176 |
| 2018 | 1.817 | 1.389 |
| 2019 | 1.727 | 1.342 |
| 2020 | 1.633 | 1.323 |
| 2021 | 1.576 | 1.254 |
| 2022 | 1.853 | 1.343 |
| 2023 | 1.461 | 1.283 |
| 2024 | 1.627 | 1.342 |
Scroll for more →
| Year | With major event days | Without major event days |
|---|---|---|
| 2014 | 135.7 | 120.8 |
| 2015 | 142.4 | 118.9 |
| 2016 | 153.9 | 122.4 |
| 2017 | 140.2 | 120.9 |
| 2018 | 279.2 | 135.2 |
| 2019 | 178.9 | 135.8 |
| 2020 | 189 | 124.9 |
| 2021 | 275.6 | 131.5 |
| 2022 | 320.4 | 139.6 |
| 2023 | 151.3 | 124.2 |
| 2024 | 257.1 | 124 |
Scroll for more →
Washington — 2014–2024 history
Direct link to Washington · Choose another state
Washington: IEEE
| Year | With major event days | Without major event days | Loss of supply removed |
|---|---|---|---|
| 2014 | 412.6 | 124.2 | 362.8 |
| 2015 | 620.9 | 120 | 417.2 |
| 2016 | 258 | 121.3 | 236.7 |
| 2017 | 311.3 | 135.8 | 301.3 |
| 2018 | 265.3 | 115.5 | 244.2 |
| 2019 | 310.9 | 105.8 | 292.2 |
| 2020 | 268.6 | 126.9 | 237.8 |
| 2021 | 554.5 | 151.1 | 468.6 |
| 2022 | 403.6 | 153.5 | 345.6 |
| 2023 | 153.8 | 129.8 | 113.4 |
| 2024 | 643.5 | 157.3 | 587.2 |
Scroll for more →
| Year | With major event days | Without major event days | Loss of supply removed |
|---|---|---|---|
| 2014 | 1.673 | 0.912 | 1.502 |
| 2015 | 1.702 | 0.842 | 1.342 |
| 2016 | 1.243 | 0.83 | 1.098 |
| 2017 | 1.367 | 0.925 | 1.229 |
| 2018 | 1.168 | 0.817 | 0.989 |
| 2019 | 1.205 | 0.783 | 1.066 |
| 2020 | 1.327 | 0.91 | 1.138 |
| 2021 | 1.756 | 1.035 | 1.45 |
| 2022 | 1.52 | 0.99 | 1.24 |
| 2023 | 1.05 | 0.915 | 0.725 |
| 2024 | 1.774 | 1.085 | 1.445 |
Scroll for more →
| Year | With major event days | Without major event days | Loss of supply removed |
|---|---|---|---|
| 2014 | 246.7 | 136.1 | 241.5 |
| 2015 | 364.7 | 142.6 | 310.9 |
| 2016 | 207.5 | 146.2 | 215.5 |
| 2017 | 227.7 | 146.7 | 245.2 |
| 2018 | 227.2 | 141.5 | 246.9 |
| 2019 | 258 | 135.1 | 274 |
| 2020 | 202.4 | 139.4 | 209 |
| 2021 | 315.8 | 145.9 | 323.1 |
| 2022 | 265.4 | 155 | 278.8 |
| 2023 | 146.5 | 141.9 | 156.4 |
| 2024 | 362.8 | 144.9 | 406.3 |
Scroll for more →
Washington: Any Method
| Year | With major event days | Without major event days |
|---|---|---|
| 2014 | 330.5 | 117.9 |
| 2015 | 646.3 | 110.9 |
| 2016 | 226 | 109.3 |
| 2017 | 269.5 | 129.9 |
| 2018 | 270.4 | 114 |
| 2019 | 300 | 105.6 |
| 2020 | 261.6 | 127 |
| 2021 | 527.3 | 150.4 |
| 2022 | 395.3 | 154.9 |
| 2023 | 151.7 | 130.6 |
| 2024 | 623.5 | 158.6 |
Scroll for more →
| Year | With major event days | Without major event days |
|---|---|---|
| 2014 | 1.513 | 0.947 |
| 2015 | 1.701 | 0.826 |
| 2016 | 1.172 | 0.782 |
| 2017 | 1.321 | 0.946 |
| 2018 | 1.211 | 0.827 |
| 2019 | 1.174 | 0.779 |
| 2020 | 1.302 | 0.906 |
| 2021 | 1.692 | 1.024 |
| 2022 | 1.481 | 0.991 |
| 2023 | 1.025 | 0.908 |
| 2024 | 1.752 | 1.087 |
Scroll for more →
| Year | With major event days | Without major event days |
|---|---|---|
| 2014 | 218.5 | 124.5 |
| 2015 | 380 | 134.2 |
| 2016 | 192.8 | 139.8 |
| 2017 | 203.9 | 137.2 |
| 2018 | 223.2 | 137.9 |
| 2019 | 255.6 | 135.6 |
| 2020 | 200.9 | 140.1 |
| 2021 | 311.5 | 146.9 |
| 2022 | 267 | 156.4 |
| 2023 | 148 | 143.8 |
| 2024 | 355.9 | 146 |
Scroll for more →
West Virginia — 2014–2024 history
Direct link to West Virginia · Choose another state
West Virginia: IEEE
| Year | With major event days | Without major event days | Loss of supply removed |
|---|---|---|---|
| 2014 | 662.8 | 449.8 | 597.6 |
| 2015 | 814.6 | 458 | 771.6 |
| 2016 | 743.4 | 439.1 | 582.9 |
| 2017 | 690.8 | 451.8 | 618 |
| 2018 | 739.7 | 513.1 | 676.3 |
| 2019 | 755.2 | 471.3 | 691.2 |
| 2020 | 604.2 | 467.9 | 538.6 |
| 2021 | 1117.2 | 451.6 | 1002 |
| 2022 | 1003.2 | 543.6 | 850.9 |
| 2023 | 751.5 | 385.7 | 700.4 |
| 2024 | 1165.5 | 486.1 | 1067.4 |
Scroll for more →
| Year | With major event days | Without major event days | Loss of supply removed |
|---|---|---|---|
| 2014 | 2.366 | 2.132 | 2.089 |
| 2015 | 2.415 | 2.15 | 2.197 |
| 2016 | 2.351 | 2.104 | 2.052 |
| 2017 | 2.333 | 2.057 | 2.027 |
| 2018 | 2.646 | 2.352 | 2.355 |
| 2019 | 2.801 | 2.352 | 2.486 |
| 2020 | 2.437 | 2.163 | 2.113 |
| 2021 | 2.383 | 2.096 | 2.106 |
| 2022 | 2.737 | 2.225 | 2.251 |
| 2023 | 2.353 | 1.871 | 2.1 |
| 2024 | 2.832 | 2.287 | 2.5 |
Scroll for more →
| Year | With major event days | Without major event days | Loss of supply removed |
|---|---|---|---|
| 2014 | 280.1 | 211 | 286.1 |
| 2015 | 337.3 | 213 | 351.2 |
| 2016 | 316.2 | 208.7 | 284 |
| 2017 | 296.1 | 219.7 | 304.9 |
| 2018 | 279.5 | 218.1 | 287.2 |
| 2019 | 269.6 | 200.4 | 278 |
| 2020 | 247.9 | 216.3 | 254.9 |
| 2021 | 468.8 | 215.5 | 475.7 |
| 2022 | 366.5 | 244.3 | 378 |
| 2023 | 319.4 | 206.2 | 333.5 |
| 2024 | 411.5 | 212.6 | 427 |
Scroll for more →
West Virginia: Any Method
| Year | With major event days | Without major event days |
|---|---|---|
| 2014 | 662.8 | 449.8 |
| 2015 | 814.6 | 458 |
| 2016 | 743.4 | 439.1 |
| 2017 | 690.8 | 451.8 |
| 2018 | 739.7 | 513.1 |
| 2019 | 755.2 | 471.3 |
| 2020 | 604.2 | 467.9 |
| 2021 | 1117.2 | 451.6 |
| 2022 | 1003.2 | 543.6 |
| 2023 | 751.5 | 385.7 |
| 2024 | 1165.5 | 486.1 |
Scroll for more →
| Year | With major event days | Without major event days |
|---|---|---|
| 2014 | 2.366 | 2.132 |
| 2015 | 2.415 | 2.15 |
| 2016 | 2.351 | 2.104 |
| 2017 | 2.333 | 2.057 |
| 2018 | 2.646 | 2.352 |
| 2019 | 2.801 | 2.352 |
| 2020 | 2.437 | 2.163 |
| 2021 | 2.383 | 2.096 |
| 2022 | 2.737 | 2.225 |
| 2023 | 2.353 | 1.871 |
| 2024 | 2.832 | 2.287 |
Scroll for more →
| Year | With major event days | Without major event days |
|---|---|---|
| 2014 | 280.1 | 211 |
| 2015 | 337.3 | 213 |
| 2016 | 316.2 | 208.7 |
| 2017 | 296.1 | 219.7 |
| 2018 | 279.5 | 218.1 |
| 2019 | 269.6 | 200.4 |
| 2020 | 247.9 | 216.3 |
| 2021 | 468.8 | 215.5 |
| 2022 | 366.5 | 244.3 |
| 2023 | 319.4 | 206.2 |
| 2024 | 411.5 | 212.6 |
Scroll for more →
Wisconsin — 2014–2024 history
Direct link to Wisconsin · Choose another state
Wisconsin: IEEE
| Year | With major event days | Without major event days | Loss of supply removed |
|---|---|---|---|
| 2014 | 154.1 | 78 | 152.9 |
| 2015 | 107.8 | 68.8 | 102.9 |
| 2016 | 147.8 | 76.3 | 144.4 |
| 2017 | 219.2 | 69.1 | 215.3 |
| 2018 | 117 | 76.4 | 108.8 |
| 2019 | 383.5 | 90 | 377.5 |
| 2020 | 119.9 | 89.1 | 114 |
| 2021 | 361.2 | 88 | 360.7 |
| 2022 | 307.9 | 104.7 | 305.2 |
| 2023 | 203.8 | 76.8 | 200.9 |
| 2024 | 296.8 | 97.5 | 294.8 |
Scroll for more →
| Year | With major event days | Without major event days | Loss of supply removed |
|---|---|---|---|
| 2014 | 0.835 | 0.673 | 0.812 |
| 2015 | 1.456 | 1.174 | 0.752 |
| 2016 | 0.864 | 0.668 | 0.826 |
| 2017 | 0.928 | 0.583 | 0.886 |
| 2018 | 0.768 | 0.649 | 0.737 |
| 2019 | 1.122 | 0.723 | 1.051 |
| 2020 | 0.833 | 0.71 | 0.774 |
| 2021 | 1.079 | 0.695 | 1.059 |
| 2022 | 1.101 | 0.763 | 1.053 |
| 2023 | 0.913 | 0.633 | 0.881 |
| 2024 | 1.041 | 0.726 | 1.021 |
Scroll for more →
| Year | With major event days | Without major event days | Loss of supply removed |
|---|---|---|---|
| 2014 | 184.7 | 115.9 | 188.4 |
| 2015 | 74.1 | 58.6 | 136.8 |
| 2016 | 171.2 | 114.2 | 175 |
| 2017 | 236.2 | 118.5 | 243.2 |
| 2018 | 152.3 | 117.7 | 147.5 |
| 2019 | 341.8 | 124.5 | 359.4 |
| 2020 | 144 | 125.4 | 147.3 |
| 2021 | 334.6 | 126.6 | 340.7 |
| 2022 | 279.6 | 137.3 | 289.8 |
| 2023 | 223.3 | 121.4 | 228 |
| 2024 | 285.2 | 134.3 | 288.8 |
Scroll for more →
Wisconsin: Any Method
| Year | With major event days | Without major event days |
|---|---|---|
| 2014 | 144.7 | 75.9 |
| 2015 | 105 | 70.3 |
| 2016 | 136.5 | 79.2 |
| 2017 | 203.5 | 78.8 |
| 2018 | 122.8 | 79.6 |
| 2019 | 356.2 | 93 |
| 2020 | 113.3 | 86.4 |
| 2021 | 311.6 | 86.4 |
| 2022 | 273.5 | 99.6 |
| 2023 | 183 | 72.4 |
| 2024 | 266.1 | 91.3 |
Scroll for more →
| Year | With major event days | Without major event days |
|---|---|---|
| 2014 | 0.838 | 0.693 |
| 2015 | 1.319 | 1.099 |
| 2016 | 0.841 | 0.686 |
| 2017 | 0.909 | 0.625 |
| 2018 | 0.811 | 0.702 |
| 2019 | 1.095 | 0.755 |
| 2020 | 0.802 | 0.703 |
| 2021 | 1.011 | 0.692 |
| 2022 | 1.043 | 0.751 |
| 2023 | 0.877 | 0.631 |
| 2024 | 1.02 | 0.729 |
Scroll for more →
| Year | With major event days | Without major event days |
|---|---|---|
| 2014 | 172.8 | 109.5 |
| 2015 | 79.6 | 64 |
| 2016 | 162.3 | 115.4 |
| 2017 | 224 | 126.1 |
| 2018 | 151.3 | 113.3 |
| 2019 | 325.3 | 123.1 |
| 2020 | 141.3 | 122.8 |
| 2021 | 308 | 124.8 |
| 2022 | 262.2 | 132.7 |
| 2023 | 208.6 | 114.7 |
| 2024 | 260.8 | 125.2 |
Scroll for more →
Wyoming — 2014–2024 history
Direct link to Wyoming · Choose another state
Wyoming: IEEE
| Year | With major event days | Without major event days | Loss of supply removed |
|---|---|---|---|
| 2014 | 201.9 | 177.4 | 166.5 |
| 2015 | 181.3 | 163.3 | 159.4 |
| 2016 | 180.2 | 135.6 | 172.5 |
| 2017 | 201.4 | 171.9 | 190.1 |
| 2018 | 125.4 | 107.1 | 116.9 |
| 2019 | 166.8 | 134 | 151.1 |
| 2020 | 293.4 | 105.1 | 263.5 |
| 2021 | 167.9 | 115.6 | 165.1 |
| 2022 | 159 | 116.1 | 157.3 |
| 2023 | 121.4 | 102.6 | 106.4 |
| 2024 | 137.8 | 116 | 128.6 |
Scroll for more →
| Year | With major event days | Without major event days | Loss of supply removed |
|---|---|---|---|
| 2014 | 1.565 | 1.496 | 1.297 |
| 2015 | 1.505 | 1.444 | 1.258 |
| 2016 | 1.511 | 1.356 | 1.445 |
| 2017 | 1.685 | 1.615 | 1.542 |
| 2018 | 1.319 | 1.19 | 1.148 |
| 2019 | 1.455 | 1.37 | 1.419 |
| 2020 | 1.892 | 1.089 | 1.703 |
| 2021 | 1.131 | 0.959 | 1.102 |
| 2022 | 1.286 | 1.146 | 1.244 |
| 2023 | 0.935 | 0.825 | 0.915 |
| 2024 | 0.999 | 0.925 | 1.018 |
Scroll for more →
| Year | With major event days | Without major event days | Loss of supply removed |
|---|---|---|---|
| 2014 | 129 | 118.6 | 128.4 |
| 2015 | 120.5 | 113.1 | 126.8 |
| 2016 | 119.3 | 99.9 | 119.4 |
| 2017 | 119.6 | 106.5 | 123.3 |
| 2018 | 95 | 90 | 101.9 |
| 2019 | 114.6 | 97.8 | 106.5 |
| 2020 | 155.1 | 96.5 | 154.8 |
| 2021 | 148.4 | 120.5 | 149.8 |
| 2022 | 123.6 | 101.3 | 126.5 |
| 2023 | 129.8 | 124.3 | 116.3 |
| 2024 | 138 | 125.4 | 126.4 |
Scroll for more →
Wyoming: Any Method
| Year | With major event days | Without major event days |
|---|---|---|
| 2014 | 193.2 | 177.6 |
| 2015 | 184.6 | 165.7 |
| 2016 | 192.5 | 150.2 |
| 2017 | 217.6 | 191.1 |
| 2018 | 136.7 | 117.6 |
| 2019 | 164.5 | 130 |
| 2020 | 289.7 | 111.3 |
| 2021 | 170.5 | 116.3 |
| 2022 | 170.1 | 113 |
| 2023 | 127 | 96 |
| 2024 | 137.8 | 109.1 |
Scroll for more →
| Year | With major event days | Without major event days |
|---|---|---|
| 2014 | 1.501 | 1.496 |
| 2015 | 1.486 | 1.444 |
| 2016 | 1.488 | 1.356 |
| 2017 | 1.662 | 1.615 |
| 2018 | 1.269 | 1.19 |
| 2019 | 1.49 | 1.285 |
| 2020 | 1.836 | 1.024 |
| 2021 | 1.163 | 0.897 |
| 2022 | 1.332 | 1.074 |
| 2023 | 0.994 | 0.77 |
| 2024 | 0.999 | 0.869 |
Scroll for more →
| Year | With major event days | Without major event days |
|---|---|---|
| 2014 | 128.7 | 118.7 |
| 2015 | 124.3 | 114.7 |
| 2016 | 129.4 | 110.7 |
| 2017 | 130.9 | 118.4 |
| 2018 | 107.7 | 98.8 |
| 2019 | 110.4 | 101.2 |
| 2020 | 157.8 | 108.7 |
| 2021 | 146.6 | 129.6 |
| 2022 | 127.7 | 105.3 |
| 2023 | 127.8 | 124.7 |
| 2024 | 138 | 125.6 |
Scroll for more →
National history, one reporting series at a time
Use the five series jump links above. Charts contain one series each; scales start at zero and differ. Exact values sit in the expandable table immediately below each chart group. Tables expand without JavaScript and are complete in the print version and CSV.
IEEE all events
SAIDI
SAIFI
CAIDI
Exact values: all three metrics, 2014–2024
| Year | SAIDI minutes per customer-year | SAIFI interruptions per customer-year | CAIDI minutes per interruption |
|---|---|---|---|
| 2014 | 236.2 | 1.257 | 188 |
| 2015 | 209 | 1.275 | 163.9 |
| 2016 | 268.4 | 1.327 | 202.2 |
| 2017 | 505.9 | 1.42 | 356.2 |
| 2018 | 349.2 | 1.34 | 260.5 |
| 2019 | 295.5 | 1.332 | 221.8 |
| 2020 | 456.1 | 1.385 | 329.3 |
| 2021 | 475.8 | 1.436 | 331.2 |
| 2022 | 333 | 1.426 | 233.5 |
| 2023 | 366.6 | 1.348 | 271.8 |
| 2024 | 662.6 | 1.531 | 432.7 |
Scroll for more →
| Year | SAIDI minutes per customer-year | SAIFI interruptions per customer-year | CAIDI minutes per interruption |
|---|---|---|---|
| 2014 | 236.2 | 1.257 | 188 |
| 2015 | 209 | 1.275 | 163.9 |
| 2016 | 268.4 | 1.327 | 202.2 |
| 2017 | 505.9 | 1.42 | 356.2 |
| 2018 | 349.2 | 1.34 | 260.5 |
| 2019 | 295.5 | 1.332 | 221.8 |
| 2020 | 456.1 | 1.385 | 329.3 |
| 2021 | 475.8 | 1.436 | 331.2 |
| 2022 | 333 | 1.426 | 233.5 |
| 2023 | 366.6 | 1.348 | 271.8 |
| 2024 | 662.6 | 1.531 | 432.7 |
Scroll for more →
IEEE without major event days
SAIDI
SAIFI
CAIDI
Exact values: all three metrics, 2014–2024
| Year | SAIDI minutes per customer-year | SAIFI interruptions per customer-year | CAIDI minutes per interruption |
|---|---|---|---|
| 2014 | 114.2 | 1.038 | 110 |
| 2015 | 117 | 1.073 | 109.1 |
| 2016 | 119.8 | 1.082 | 110.7 |
| 2017 | 117 | 1.023 | 114.3 |
| 2018 | 121.4 | 1.051 | 115.5 |
| 2019 | 122.2 | 1.04 | 117.5 |
| 2020 | 116 | 1.013 | 114.5 |
| 2021 | 125.7 | 1.039 | 120.9 |
| 2022 | 131.1 | 1.09 | 120.2 |
| 2023 | 123.9 | 1.022 | 121.3 |
| 2024 | 131.6 | 1.065 | 123.6 |
Scroll for more →
| Year | SAIDI minutes per customer-year | SAIFI interruptions per customer-year | CAIDI minutes per interruption |
|---|---|---|---|
| 2014 | 114.2 | 1.038 | 110 |
| 2015 | 117 | 1.073 | 109.1 |
| 2016 | 119.8 | 1.082 | 110.7 |
| 2017 | 117 | 1.023 | 114.3 |
| 2018 | 121.4 | 1.051 | 115.5 |
| 2019 | 122.2 | 1.04 | 117.5 |
| 2020 | 116 | 1.013 | 114.5 |
| 2021 | 125.7 | 1.039 | 120.9 |
| 2022 | 131.1 | 1.09 | 120.2 |
| 2023 | 123.9 | 1.022 | 121.3 |
| 2024 | 131.6 | 1.065 | 123.6 |
Scroll for more →
IEEE loss of supply removed
SAIDI
SAIFI
CAIDI
Exact values: all three metrics, 2014–2024
| Year | SAIDI minutes per customer-year | SAIFI interruptions per customer-year | CAIDI minutes per interruption |
|---|---|---|---|
| 2014 | 244.8 | 1.202 | 203.7 |
| 2015 | 198.2 | 1.163 | 170.4 |
| 2016 | 257 | 1.23 | 209 |
| 2017 | 489.6 | 1.254 | 390.6 |
| 2018 | 338.5 | 1.193 | 283.8 |
| 2019 | 289.1 | 1.189 | 243 |
| 2020 | 460.5 | 1.238 | 371.9 |
| 2021 | 404.5 | 1.294 | 312.6 |
| 2022 | 324.7 | 1.315 | 246.9 |
| 2023 | 357.7 | 1.242 | 288 |
| 2024 | 646.1 | 1.431 | 451.6 |
Scroll for more →
| Year | SAIDI minutes per customer-year | SAIFI interruptions per customer-year | CAIDI minutes per interruption |
|---|---|---|---|
| 2014 | 244.8 | 1.202 | 203.7 |
| 2015 | 198.2 | 1.163 | 170.4 |
| 2016 | 257 | 1.23 | 209 |
| 2017 | 489.6 | 1.254 | 390.6 |
| 2018 | 338.5 | 1.193 | 283.8 |
| 2019 | 289.1 | 1.189 | 243 |
| 2020 | 460.5 | 1.238 | 371.9 |
| 2021 | 404.5 | 1.294 | 312.6 |
| 2022 | 324.7 | 1.315 | 246.9 |
| 2023 | 357.7 | 1.242 | 288 |
| 2024 | 646.1 | 1.431 | 451.6 |
Scroll for more →
Any Method all events
SAIDI
SAIFI
CAIDI
Exact values: all three metrics, 2014–2024
| Year | SAIDI minutes per customer-year | SAIFI interruptions per customer-year | CAIDI minutes per interruption |
|---|---|---|---|
| 2014 | 219 | 1.22 | 179.6 |
| 2015 | 205 | 1.246 | 164.5 |
| 2016 | 249.2 | 1.292 | 192.9 |
| 2017 | 473.1 | 1.394 | 339.3 |
| 2018 | 346.4 | 1.325 | 261.5 |
| 2019 | 284.6 | 1.325 | 214.8 |
| 2020 | 491.9 | 1.44 | 341.7 |
| 2021 | 440 | 1.425 | 308.8 |
| 2022 | 335.5 | 1.405 | 238.8 |
| 2023 | 342 | 1.333 | 256.6 |
| 2024 | 611.3 | 1.521 | 401.9 |
Scroll for more →
| Year | SAIDI minutes per customer-year | SAIFI interruptions per customer-year | CAIDI minutes per interruption |
|---|---|---|---|
| 2014 | 219 | 1.22 | 179.6 |
| 2015 | 205 | 1.246 | 164.5 |
| 2016 | 249.2 | 1.292 | 192.9 |
| 2017 | 473.1 | 1.394 | 339.3 |
| 2018 | 346.4 | 1.325 | 261.5 |
| 2019 | 284.6 | 1.325 | 214.8 |
| 2020 | 491.9 | 1.44 | 341.7 |
| 2021 | 440 | 1.425 | 308.8 |
| 2022 | 335.5 | 1.405 | 238.8 |
| 2023 | 342 | 1.333 | 256.6 |
| 2024 | 611.3 | 1.521 | 401.9 |
Scroll for more →
Any Method without major events
SAIDI
SAIFI
CAIDI
Exact values: all three metrics, 2014–2024
| Year | SAIDI minutes per customer-year | SAIFI interruptions per customer-year | CAIDI minutes per interruption |
|---|---|---|---|
| 2014 | 109.7 | 1.019 | 107.7 |
| 2015 | 113.1 | 1.046 | 108.1 |
| 2016 | 116.9 | 1.062 | 110 |
| 2017 | 114.4 | 1.007 | 113.6 |
| 2018 | 117.2 | 1.028 | 114 |
| 2019 | 118.6 | 1.017 | 116.6 |
| 2020 | 119 | 1.037 | 114.7 |
| 2021 | 121.5 | 1.025 | 118.5 |
| 2022 | 125.7 | 1.064 | 118.1 |
| 2023 | 118.4 | 0.999 | 118.5 |
| 2024 | 126 | 1.043 | 120.8 |
Scroll for more →
| Year | SAIDI minutes per customer-year | SAIFI interruptions per customer-year | CAIDI minutes per interruption |
|---|---|---|---|
| 2014 | 109.7 | 1.019 | 107.7 |
| 2015 | 113.1 | 1.046 | 108.1 |
| 2016 | 116.9 | 1.062 | 110 |
| 2017 | 114.4 | 1.007 | 113.6 |
| 2018 | 117.2 | 1.028 | 114 |
| 2019 | 118.6 | 1.017 | 116.6 |
| 2020 | 119 | 1.037 | 114.7 |
| 2021 | 121.5 | 1.025 | 118.5 |
| 2022 | 125.7 | 1.064 | 118.1 |
| 2023 | 118.4 | 0.999 | 118.5 |
| 2024 | 126 | 1.043 | 120.8 |
Scroll for more →
Reporting method, coverage and limits
EIA receives annual utility reliability reports on Form EIA-861. Its Electric Power Annual technical notes describe customer-weighted aggregates using customers reported for each metric. We transcribe EIA's published aggregates; we do not aggregate utilities, average states or estimate missing cells.
IEEE means IEEE 1366-2003 or 1366-2012. Any Method includes both IEEE and non-IEEE reporters and remains a separate population. IEEE major event days exceed the daily-SAIDI threshold Tmed based on the preceding five years; other-method major events are utility-defined. Loss of Supply Removed excludes interruptions from high-voltage/bulk-power supply and is not the without-major-event-days series.
These measures describe non-momentary interruptions. With/without major events is a statistical treatment, not a weather-only split. A single storm can dominate a state-year. A gap does not identify the contributing event or cause.
The aggregate tables do not provide each series/year's utility roster, metric-specific customer coverage, missing reporters or event-day list. Coverage and reporter mix can change. A state ranking describes the reported customer aggregate in one year, not every household or utility. Historical changes need not reflect a fixed population or steady trend. These are not real-time conditions, household risk scores, outage forecasts or battery-sizing instructions.
Report a correction: use the Plainly Prepared contact page; name the geography, year, metric, series and original EIA table cell. Corrections will identify the source version and date.
Sources, update record and citation
Original source: U.S. Energy Information Administration, Electric Power Annual, Form EIA-861. Data year 2024; released October 16, 2025; next scheduled release October 2026. National Table 11.1 was retained September 29, 2026. State Tables 11.4–11.6 and the official report technical notes were retrieved by unauthenticated public download October 1, 2026. They publish 2014–2024 in the same five labelled series. No earlier years are added by another method.
- EIA Electric Power Annual release page
- EIA Table 11.1: national metrics
- EIA data reuse policy
- EIA Table 11.4: state SAIDI
- EIA Table 11.5: state SAIFI
- EIA Table 11.6: state CAIDI
- Electric Power Annual technical notes
How to cite: Plainly Prepared, “U.S. Power Outage Statistics, 2014–2024,” compilation of EIA Tables 11.1 and 11.4–11.6, updated October 1, 2026, disaster-report.com/research/us-power-outage-statistics/. Credit EIA as original source; name geography, year, metric, method and event treatment. Label calculations derived and give their arithmetic.
The latest data in this report cover 2024. EIA schedules its next Electric Power Annual release for October 2026.
Where outage statistics fit in a home power plan
Annual aggregates do not describe a specific home. Start with our generator and battery backup guide and power station versus generator comparison. Use appliance nameplates and maker instructions for equipment-specific planning.
U.S. Power Outage Statistics, 2014–2024
Compare annual outage minutes by state, then check the national record. EIA methods and major-event treatments stay separate. Latest published year: 2024; history: 2014–2024.
SAIDI measures minutes of non-momentary interruptions per customer-year. SAIFI measures interruptions per customer-year. CAIDI measures restoration minutes per interruption. An annual average is not the length of one outage or a forecast for your home.
National overview: latest year and first-to-last change
Each row is a separate population/treatment. Signed changes are derived: 2024 minus 2014 in the same units. This is not a causal or fixed-coverage trend estimate.
| Series | SAIDI | SAIFI | CAIDI |
|---|---|---|---|
| IEEE all events | 662.6 minutes per customer-year Derived change: +426.4 | 1.531 interruptions per customer-year Derived change: +0.274 | 432.7 minutes per interruption Derived change: +244.7 |
| IEEE without major event days | 131.6 minutes per customer-year Derived change: +17.4 | 1.065 interruptions per customer-year Derived change: +0.027 | 123.6 minutes per interruption Derived change: +13.6 |
| IEEE loss of supply removed | 646.1 minutes per customer-year Derived change: +401.3 | 1.431 interruptions per customer-year Derived change: +0.229 | 451.6 minutes per interruption Derived change: +247.9 |
| Any Method all events | 611.3 minutes per customer-year Derived change: +392.3 | 1.521 interruptions per customer-year Derived change: +0.301 | 401.9 minutes per interruption Derived change: +222.3 |
| Any Method without major events | 126 minutes per customer-year Derived change: +16.3 | 1.043 interruptions per customer-year Derived change: +0.024 | 120.8 minutes per interruption Derived change: +13.1 |
Scroll for more →
National findings, with arithmetic
- Derived: IEEE all-events SAIDI rose 180.5% from 2014 to 2024. 662.6 − 236.2 = 426.4 minutes per customer-year. These are the first and last years, not the minimum and maximum.
- Derived: the 2024 IEEE event-treatment gap is 531.0 minutes per customer-year. 662.6 − 131.6; 80.1% of the all-events value. This does not identify a cause.
- Observed: IEEE all-events SAIDI is highest in this eleven-year snapshot at 662.6 in 2024 and lowest at 209 in 2015.
- Derived, min-to-max only: 662.6 − 209 = 453.6 minutes; 217.0%. This is the 2015 minimum to 2024 maximum, not the first-to-last change.
Power outage minutes by state, 2024
These are observed EIA-published state aggregates, not our utility estimates. This view ranks IEEE SAIDI only. The state CSV preserves all three metrics and all five EIA series for 50 states, D.C. and the U.S. over 2014–2024. Blank source cells display UNKNOWN; numeric CSV fields are empty with per-metric status columns. Any Method is not blended into the IEEE ranking.
- Observed, one year (2024): South Carolina has the most all-events outage minutes among the 50 states: 3155 minutes per customer-year. Derived 2014–2024 range for South Carolina: 122.9–3155. This single-year ranking does not establish a persistently worst state.
- Observed, one year (2024): Arizona has the fewest: 83.6 minutes per customer-year. Derived 2014–2024 range for Arizona: 70.6–136.9; a single year is not a household forecast.
- Observed, one year (2024): West Virginia has the highest without-major-event-days value: 486.1 minutes per customer-year. Derived 2014–2024 range for West Virginia, same treatment: 385.7–543.6.
- Derived, one year (2024): South Carolina has the widest gap: 3155 − 115.9 = 3039.1 minutes per customer-year. Derived 2014–2024 range of annual gaps for South Carolina: 21.6–3039.1. This subtraction does not attribute the difference to weather.
National reference, same IEEE measures: all events 662.6; without major event days 131.6 minutes per customer-year. This is EIA's published national aggregate, not an average of states. Findings above exclude D.C.; the table labels it separately.
| State / D.C. | With major event days | Without major event days | Derived gap: all − without |
|---|---|---|---|
| Alabama | 197.7 | 120.8 | 76.9 |
| Alaska | 323.2 | 192.4 | 130.8 |
| Arizona | 83.6 | 69.8 | 13.8 |
| Arkansas | 527.8 | 201.9 | 325.9 |
| California | 285 | 164.4 | 120.6 |
| Colorado | 257 | 118.9 | 138.1 |
| Connecticut | 152.8 | 73.6 | 79.2 |
| Delaware | 117.9 | 66.8 | 51.1 |
| District of Columbia | 32.6 | 26.4 | 6.2 |
| Florida | 1487.6 | 66.7 | 1420.9 |
| Georgia | 1208.1 | 211.4 | 996.7 |
| Hawaii | 382.6 | 219.3 | 163.3 |
| Idaho | 204.4 | 152.5 | 51.9 |
| Illinois | 158 | 59.1 | 98.9 |
| Indiana | 310 | 123.3 | 186.7 |
| Iowa | 200.3 | 84.1 | 116.2 |
| Kansas | 289.8 | 104 | 185.8 |
| Kentucky | 537.7 | 145.7 | 392.0 |
| Louisiana | 630.6 | 215.9 | 414.7 |
| Maine | 1748.6 | 274 | 1474.6 |
| Maryland | 118.1 | 75.1 | 43.0 |
| Massachusetts | 103.7 | 77 | 26.7 |
| Michigan | 481.7 | 161.3 | 320.4 |
| Minnesota | 222.4 | 91.5 | 130.9 |
| Mississippi | 607.3 | 279 | 328.3 |
| Missouri | 212.6 | 106.6 | 106.0 |
| Montana | 341.7 | 152.3 | 189.4 |
| Nebraska | 697.8 | 69.8 | 628.0 |
| Nevada | 158.9 | 63.8 | 95.1 |
| New Hampshire | 735.5 | 84.2 | 651.3 |
| New Jersey | 173.3 | 98.8 | 74.5 |
| New Mexico | 272.6 | 152 | 120.6 |
| New York | 477.3 | 142.8 | 334.5 |
| North Carolina | 1518.1 | 143.9 | 1374.2 |
| North Dakota | 102.7 | 87 | 15.7 |
| Ohio | 511 | 133.3 | 377.7 |
| Oklahoma | 220.7 | 121.3 | 99.4 |
| Oregon | 579.3 | 124.1 | 455.2 |
| Pennsylvania | 353.1 | 131.5 | 221.6 |
| Rhode Island | 104.3 | 60.8 | 43.5 |
| South Carolina | 3155 | 115.9 | 3039.1 |
| South Dakota | 85.6 | 61.5 | 24.1 |
| Tennessee | 289.3 | 169.9 | 119.4 |
| Texas | 1614.3 | 153.4 | 1460.9 |
| Utah | 115.4 | 105 | 10.4 |
| Vermont | 895.8 | 231.8 | 664.0 |
| Virginia | 962.1 | 245.1 | 717.0 |
| Washington | 643.5 | 157.3 | 486.2 |
| West Virginia | 1165.5 | 486.1 | 679.4 |
| Wisconsin | 296.8 | 97.5 | 199.3 |
| Wyoming | 137.8 | 116 | 21.8 |
Scroll for more →
Full 2014–2024 state history, all five series and all metrics: download the state history CSV. Numeric missing cells are empty with per-metric UNKNOWN status; OBSERVED_ZERO identifies published zeros. Hawaii 2024 IEEE loss-of-supply-removed SAIDI and SAIFI are genuine EIA zeros, while CAIDI is UNKNOWN.
IEEE all events
| Year | SAIDI minutes per customer-year | SAIFI interruptions per customer-year | CAIDI minutes per interruption |
|---|---|---|---|
| 2014 | 236.2 | 1.257 | 188 |
| 2015 | 209 | 1.275 | 163.9 |
| 2016 | 268.4 | 1.327 | 202.2 |
| 2017 | 505.9 | 1.42 | 356.2 |
| 2018 | 349.2 | 1.34 | 260.5 |
| 2019 | 295.5 | 1.332 | 221.8 |
| 2020 | 456.1 | 1.385 | 329.3 |
| 2021 | 475.8 | 1.436 | 331.2 |
| 2022 | 333 | 1.426 | 233.5 |
| 2023 | 366.6 | 1.348 | 271.8 |
| 2024 | 662.6 | 1.531 | 432.7 |
Scroll for more →
IEEE without major event days
| Year | SAIDI minutes per customer-year | SAIFI interruptions per customer-year | CAIDI minutes per interruption |
|---|---|---|---|
| 2014 | 114.2 | 1.038 | 110 |
| 2015 | 117 | 1.073 | 109.1 |
| 2016 | 119.8 | 1.082 | 110.7 |
| 2017 | 117 | 1.023 | 114.3 |
| 2018 | 121.4 | 1.051 | 115.5 |
| 2019 | 122.2 | 1.04 | 117.5 |
| 2020 | 116 | 1.013 | 114.5 |
| 2021 | 125.7 | 1.039 | 120.9 |
| 2022 | 131.1 | 1.09 | 120.2 |
| 2023 | 123.9 | 1.022 | 121.3 |
| 2024 | 131.6 | 1.065 | 123.6 |
Scroll for more →
IEEE loss of supply removed
| Year | SAIDI minutes per customer-year | SAIFI interruptions per customer-year | CAIDI minutes per interruption |
|---|---|---|---|
| 2014 | 244.8 | 1.202 | 203.7 |
| 2015 | 198.2 | 1.163 | 170.4 |
| 2016 | 257 | 1.23 | 209 |
| 2017 | 489.6 | 1.254 | 390.6 |
| 2018 | 338.5 | 1.193 | 283.8 |
| 2019 | 289.1 | 1.189 | 243 |
| 2020 | 460.5 | 1.238 | 371.9 |
| 2021 | 404.5 | 1.294 | 312.6 |
| 2022 | 324.7 | 1.315 | 246.9 |
| 2023 | 357.7 | 1.242 | 288 |
| 2024 | 646.1 | 1.431 | 451.6 |
Scroll for more →
Any Method all events
| Year | SAIDI minutes per customer-year | SAIFI interruptions per customer-year | CAIDI minutes per interruption |
|---|---|---|---|
| 2014 | 219 | 1.22 | 179.6 |
| 2015 | 205 | 1.246 | 164.5 |
| 2016 | 249.2 | 1.292 | 192.9 |
| 2017 | 473.1 | 1.394 | 339.3 |
| 2018 | 346.4 | 1.325 | 261.5 |
| 2019 | 284.6 | 1.325 | 214.8 |
| 2020 | 491.9 | 1.44 | 341.7 |
| 2021 | 440 | 1.425 | 308.8 |
| 2022 | 335.5 | 1.405 | 238.8 |
| 2023 | 342 | 1.333 | 256.6 |
| 2024 | 611.3 | 1.521 | 401.9 |
Scroll for more →
Any Method without major events
| Year | SAIDI minutes per customer-year | SAIFI interruptions per customer-year | CAIDI minutes per interruption |
|---|---|---|---|
| 2014 | 109.7 | 1.019 | 107.7 |
| 2015 | 113.1 | 1.046 | 108.1 |
| 2016 | 116.9 | 1.062 | 110 |
| 2017 | 114.4 | 1.007 | 113.6 |
| 2018 | 117.2 | 1.028 | 114 |
| 2019 | 118.6 | 1.017 | 116.6 |
| 2020 | 119 | 1.037 | 114.7 |
| 2021 | 121.5 | 1.025 | 118.5 |
| 2022 | 125.7 | 1.064 | 118.1 |
| 2023 | 118.4 | 0.999 | 118.5 |
| 2024 | 126 | 1.043 | 120.8 |
Scroll for more →
Reporting method, coverage and limits
EIA receives annual utility reliability reports on Form EIA-861. Its Electric Power Annual technical notes describe customer-weighted aggregates using customers reported for each metric. We transcribe EIA's published aggregates; we do not aggregate utilities, average states or estimate missing cells.
IEEE means IEEE 1366-2003 or 1366-2012. Any Method includes both IEEE and non-IEEE reporters and remains a separate population. IEEE major event days exceed the daily-SAIDI threshold Tmed based on the preceding five years; other-method major events are utility-defined. Loss of Supply Removed excludes interruptions from high-voltage/bulk-power supply and is not the without-major-event-days series.
These measures describe non-momentary interruptions. With/without major events is a statistical treatment, not a weather-only split. A single storm can dominate a state-year. A gap does not identify the contributing event or cause.
The aggregate tables do not provide each series/year's utility roster, metric-specific customer coverage, missing reporters or event-day list. Coverage and reporter mix can change. A state ranking describes the reported customer aggregate in one year, not every household or utility. Historical changes need not reflect a fixed population or steady trend. These are not real-time conditions, household risk scores, outage forecasts or battery-sizing instructions.
Report a correction: use the Plainly Prepared contact page; name the geography, year, metric, series and original EIA table cell. Corrections will identify the source version and date.
Sources, update record and citation
Original source: U.S. Energy Information Administration, Electric Power Annual, Form EIA-861. Data year 2024; released October 16, 2025; next scheduled release October 2026. National Table 11.1 was retained September 29, 2026. State Tables 11.4–11.6 and the official report technical notes were retrieved by unauthenticated public download October 1, 2026. They publish 2014–2024 in the same five labelled series. No earlier years are added by another method.
- EIA Electric Power Annual release page
- EIA Table 11.1: national metrics
- EIA data reuse policy
- EIA Table 11.4: state SAIDI
- EIA Table 11.5: state SAIFI
- EIA Table 11.6: state CAIDI
- Electric Power Annual technical notes
How to cite: Plainly Prepared, “U.S. Power Outage Statistics, 2014–2024,” compilation of EIA Tables 11.1 and 11.4–11.6, updated October 1, 2026, disaster-report.com/research/us-power-outage-statistics/. Credit EIA as original source; name geography, year, metric, method and event treatment. Label calculations derived and give their arithmetic.
The latest data in this report cover 2024. EIA schedules its next Electric Power Annual release for October 2026.